Creating application with FreeRTOS
This chapter covers the basics of a quick-start project including creating, building, running, and debugging applications. This project referred to in this chapter is called Blinky. This application prints Blink text. Through the debug session, users can examine RTOS objects such as Task and Queue. The application can also be built and run on QEMU emulator.
To build, run and debug Blinky applications with QEMU emulator, please install the xplor-studio-freertos-debug-plugin and freertos-virt-qemu-blinky-example components first. Please refer to Component Management for more information.
Create a new project
First, open XploR Studio IDE by the following command:
xip ide start
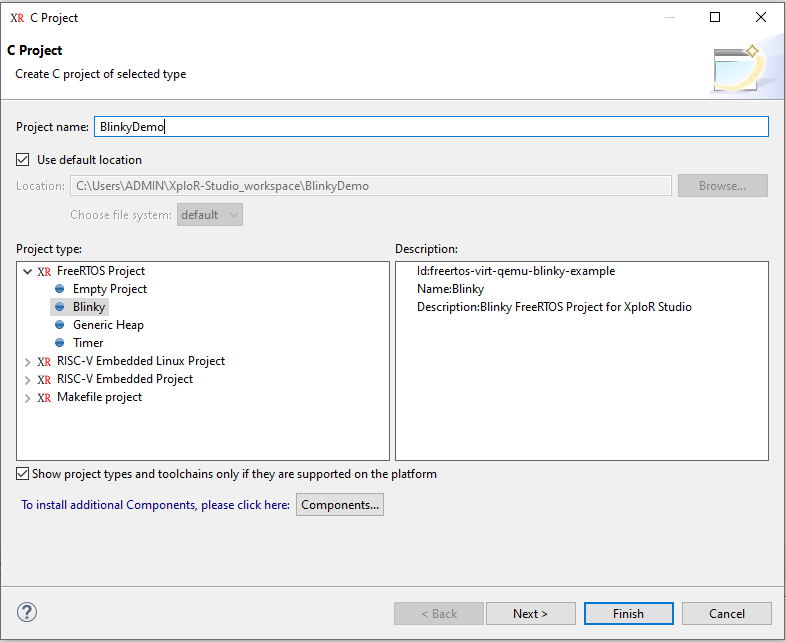
The easiest way to use FreeRTOS is to start with one of the pre-configured demo application projects by selecting File > New > C Project choose Blinky project. Then click Next.
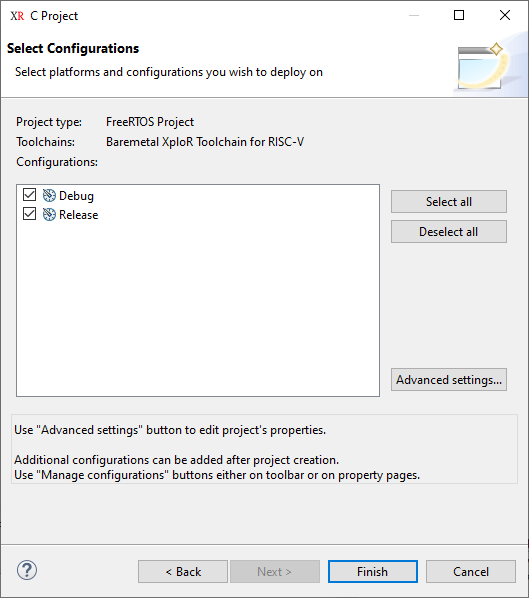
Then click Finish.
Note: For more project examples, please install
Example Projects components.
Update build settings
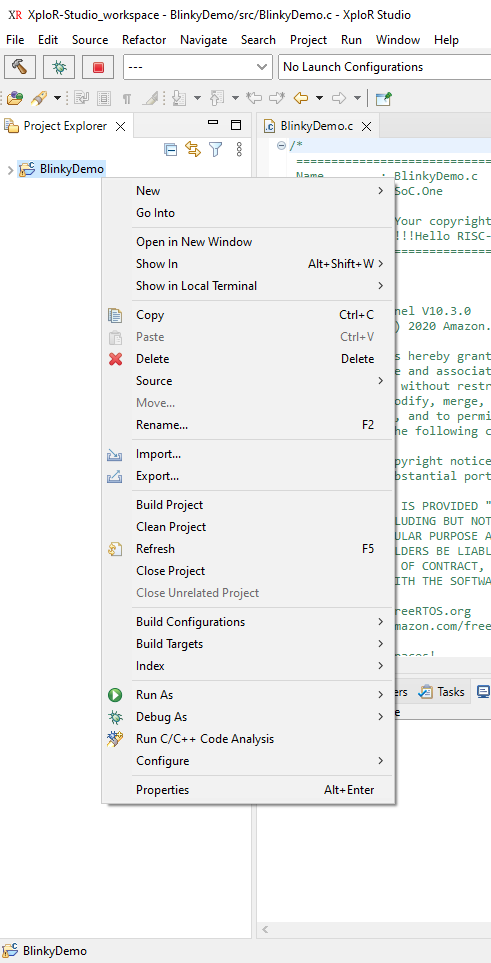
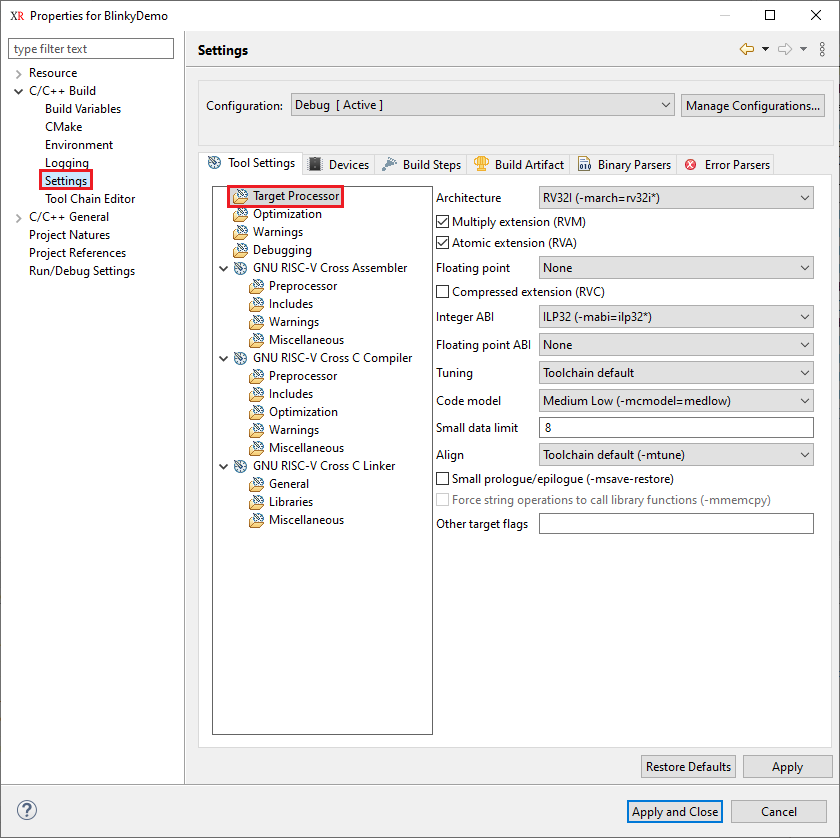
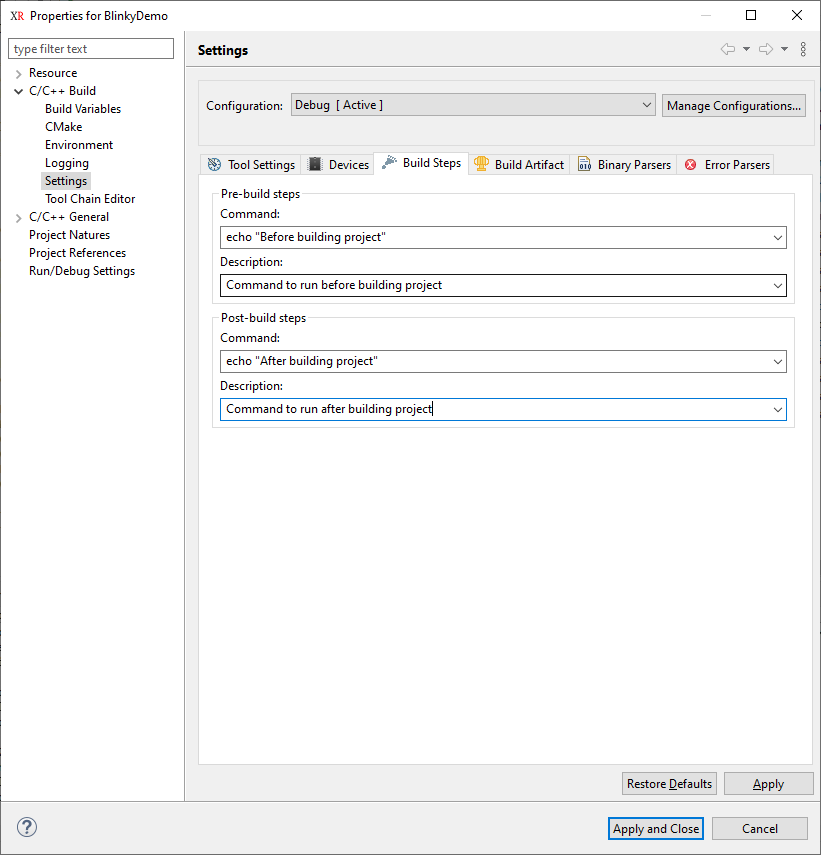
After the project is created, the user can change build settings or other project settings by right-clicking on the project name in Project Explorer and selecting Properties. Then select C/C++ Build > Settings
Note: The Floating-point ABI – Single precision (f) is currently not supported in this release (except Embedded projects).
For example, on the Target Processor menu, users can change the architecture from 32 bits to 64 bits, and also select floating-point options.
Another useful setting is to add hooks before and after the build. For example:
Build project
- Building is simply done by clicking on the build button in the toolbar:

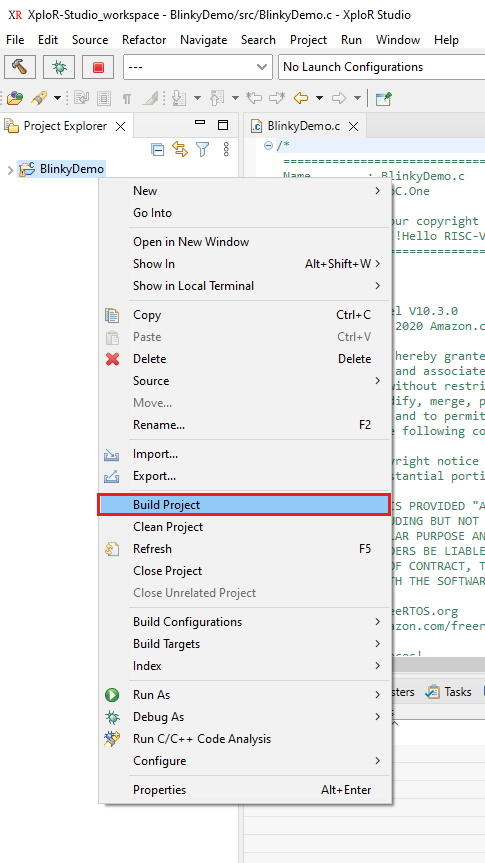
- Or right-click on the current project > Build Project
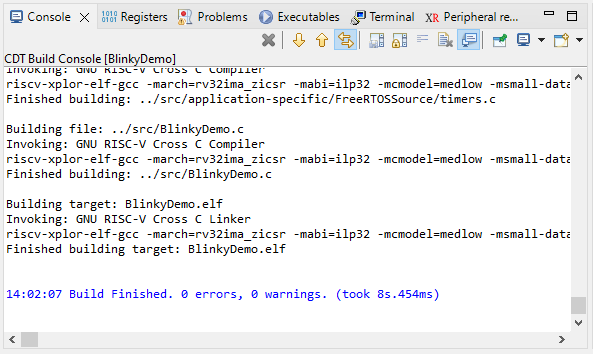
Messages in the Console view:
Running and Debugging project with QEMU emulator
Run project on QEMU emulator
XploR Studio offers several ways to run applications:
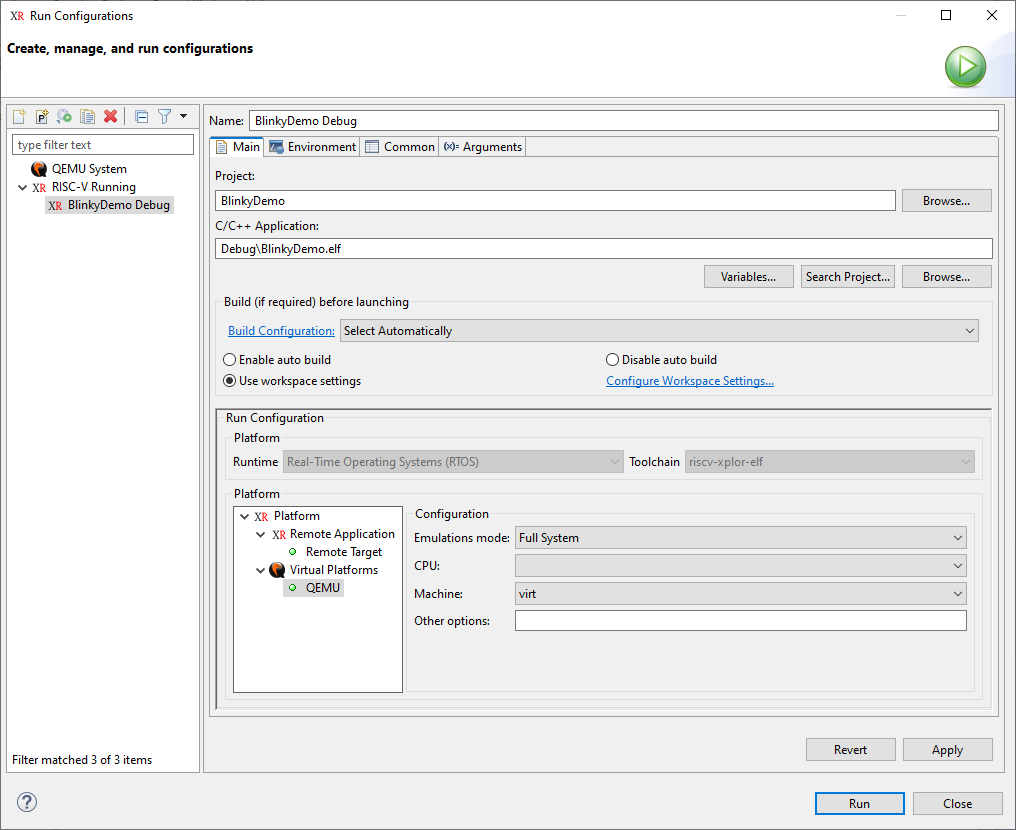
Select the BlinkyDemo entry in the Project Explorer then open the Run Configuration Dialog. Doing so will enable Eclipse to automatically fill out the necessary run configuration information.
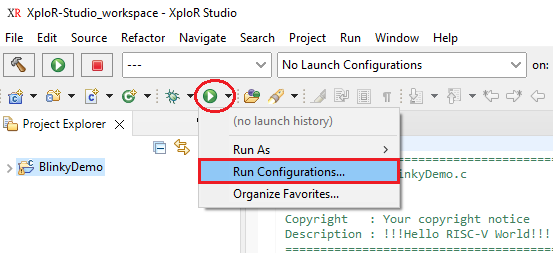
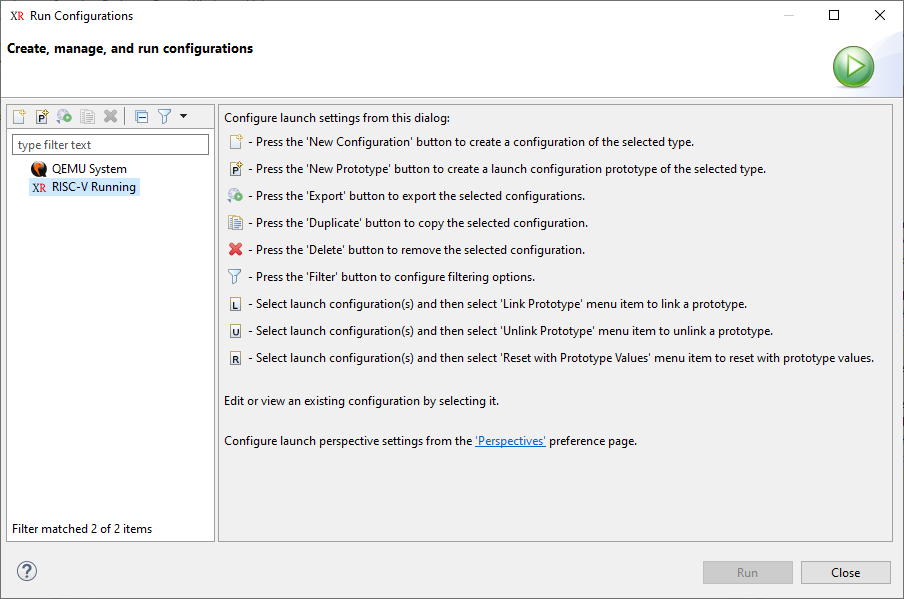
In Run Configuration Dialog box, create a new run configuration by double-clicking on RISC-V Running
On the Main tab, choose option QEMU in Virtual Platforms. Click Apply then click Run.
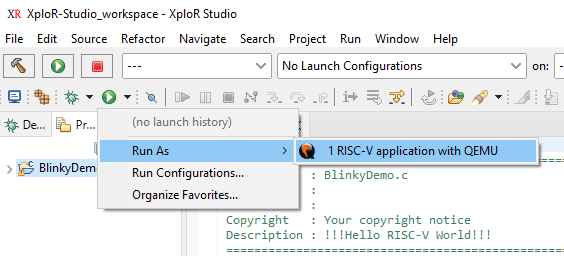
Select the Blinky Demo Project entry in the Project Explorer and then click Run As > RISC-V application with QEMU
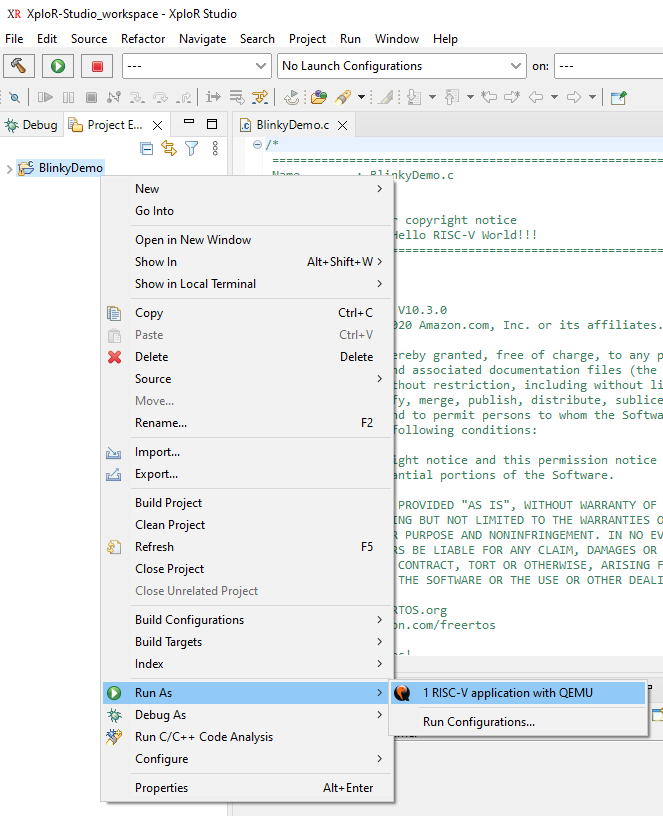
Right-click on current project > Run As > RISV-C application with QEMU
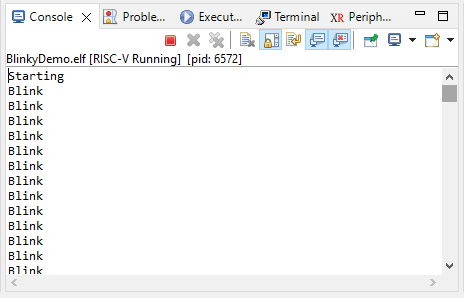
After selecting Run As RISC-V application with QEMU, the “Blink” text will be printed continuously in Console view.
Debug project on QEMU Emulator
XploR Studio offers several ways to debug applications:
Select the BlinkyDemo entry in the Project Explorer then open the Debug Configuration Dialog. Doing so will enable Eclipse to automatically fill out the necessary debug configuration information.
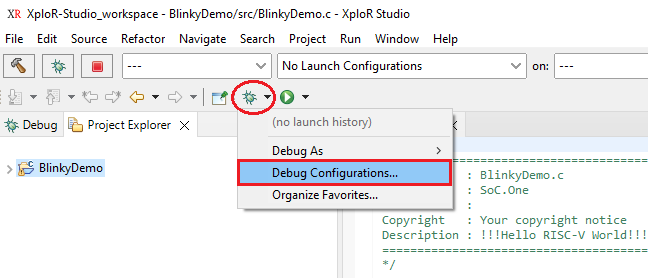
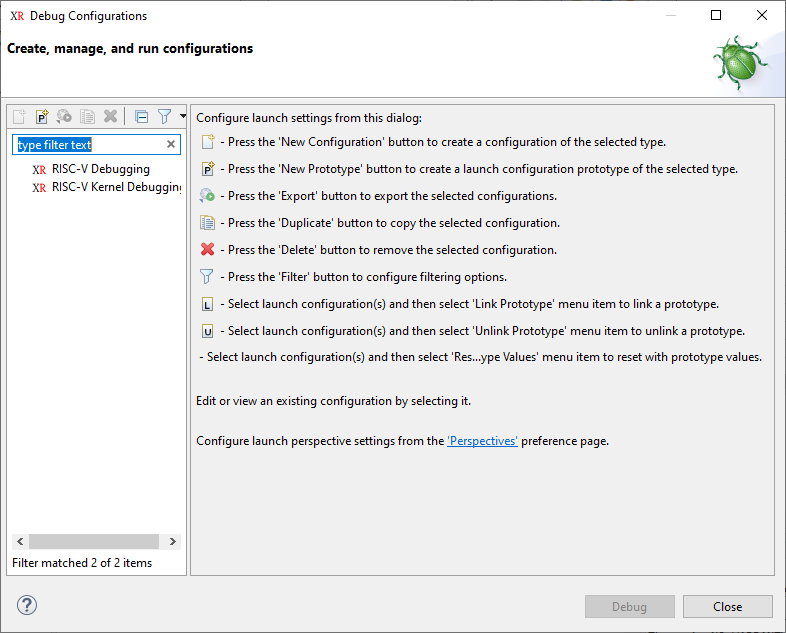
In Debug Configuration Dialog box, create a new debug configuration by double-clicking on RISC-V Debugging
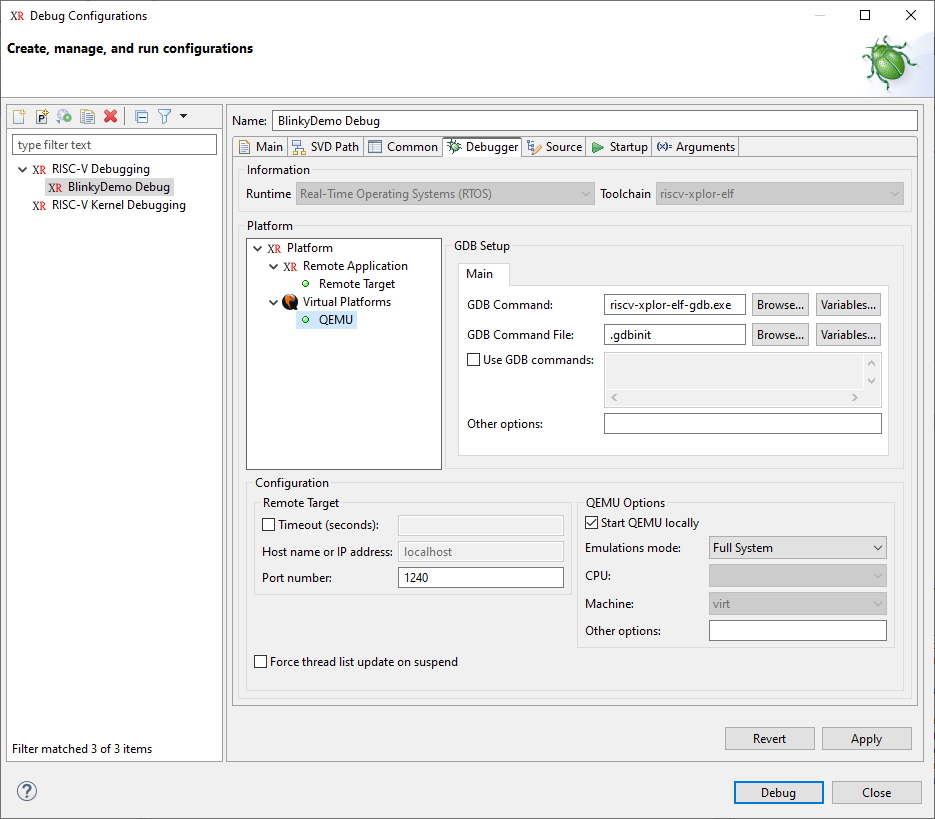
On the Debugger tab, choose option QEMU in Virtual Platforms. Click Apply then click Debug.
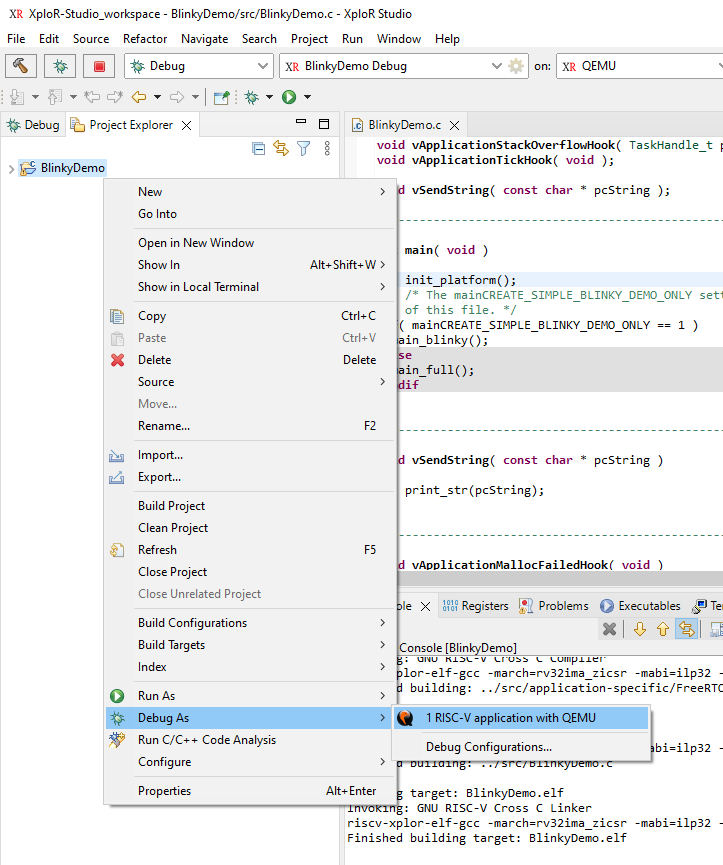
Select the Blinky Demo Project entry in the Project Explorer and then click Debug As/RISC-V application with QEMU
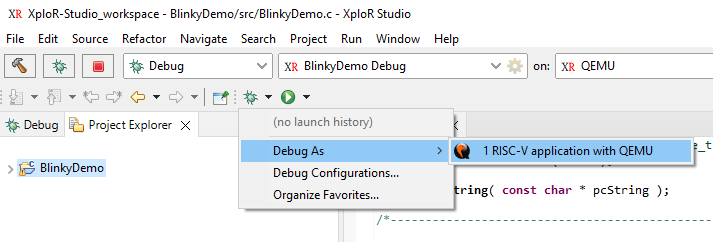
Right-click on current project > Debug As > RISV-C application with QEMU
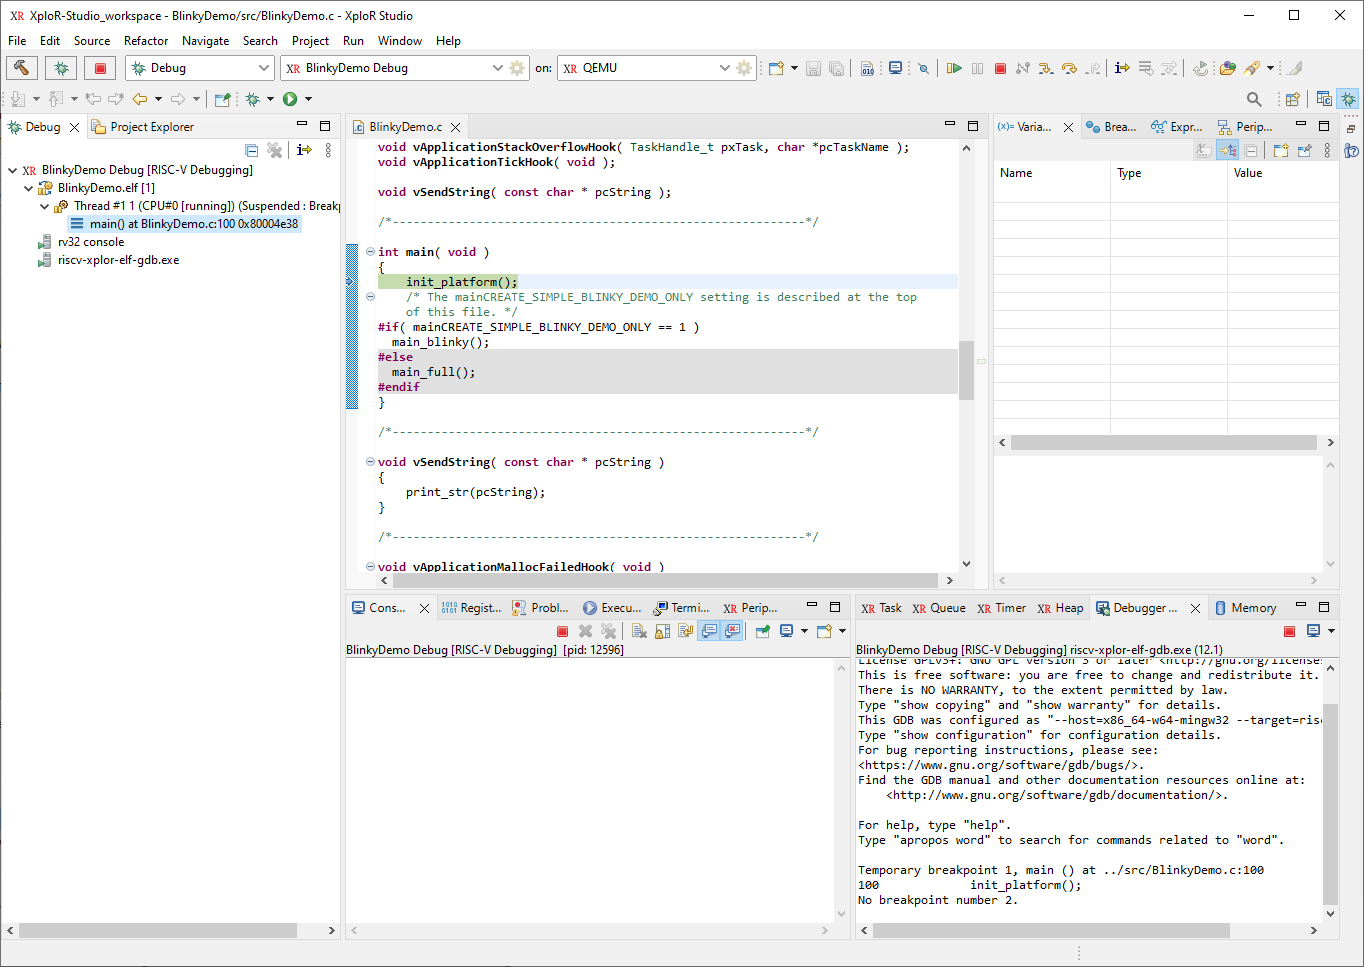
After selecting Debug As RISC-V application with QEMU, the IDE changes to the debug perspective and automatically sets a breakpoint in the first line of code in the main() function.
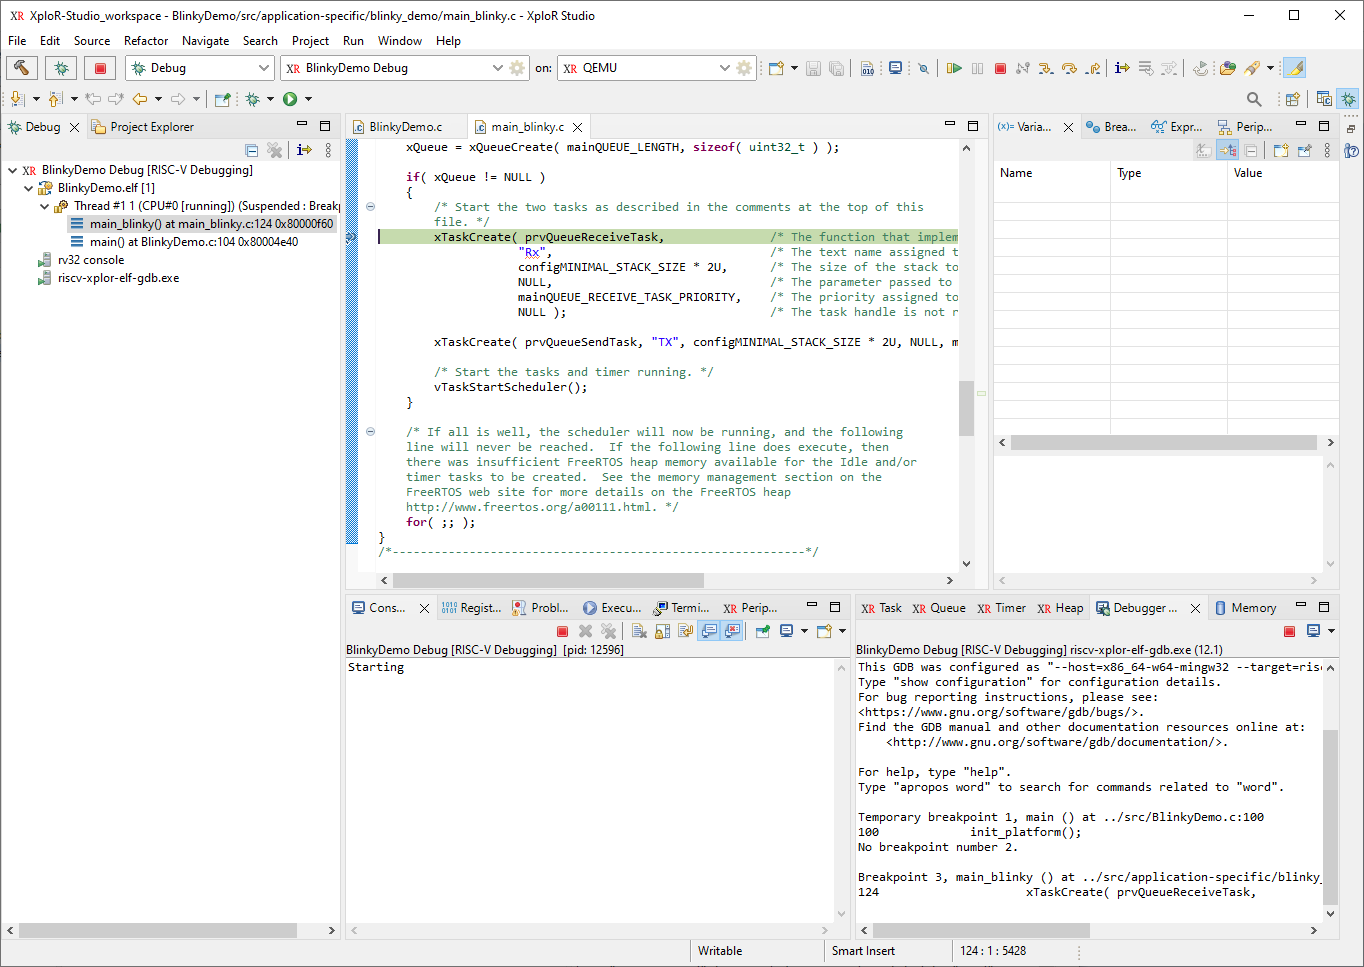
Open main_blinky.c source code file in src/application-specific/blinky_demo > Set more breakpoints in Task and Queue object.
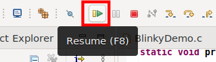
Press F8 or click on Resume button to go to the next breakpoint
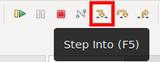
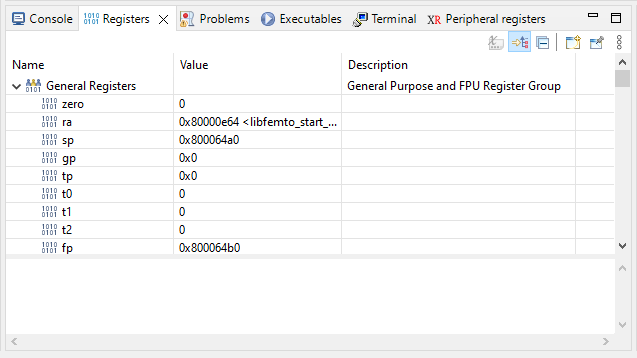
Continue debugging with press F5 or clicking on Step Into button to step into the line of code
and see data change in Register View
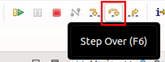
Continue debugging with press F6 or clicking on Step Over button for step over
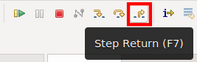
Press F7 or click on Step Return (F7) button for step return code
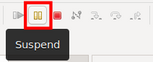
Click on the Suspend button to pause the debug process.
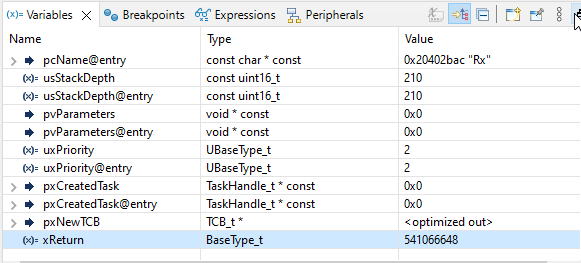
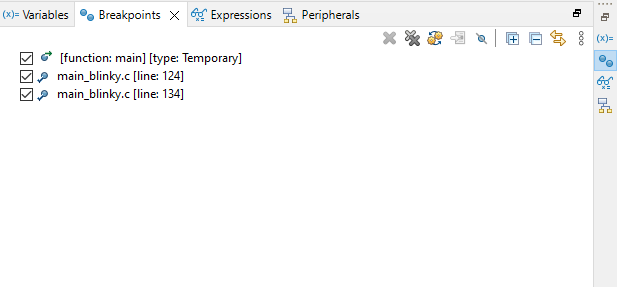
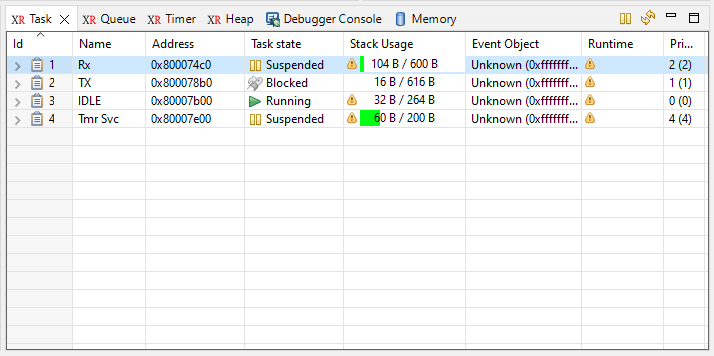
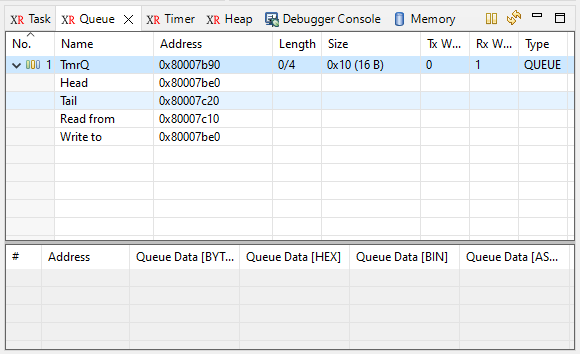
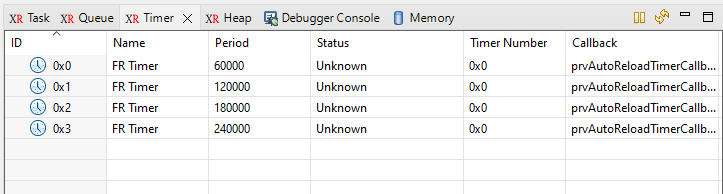
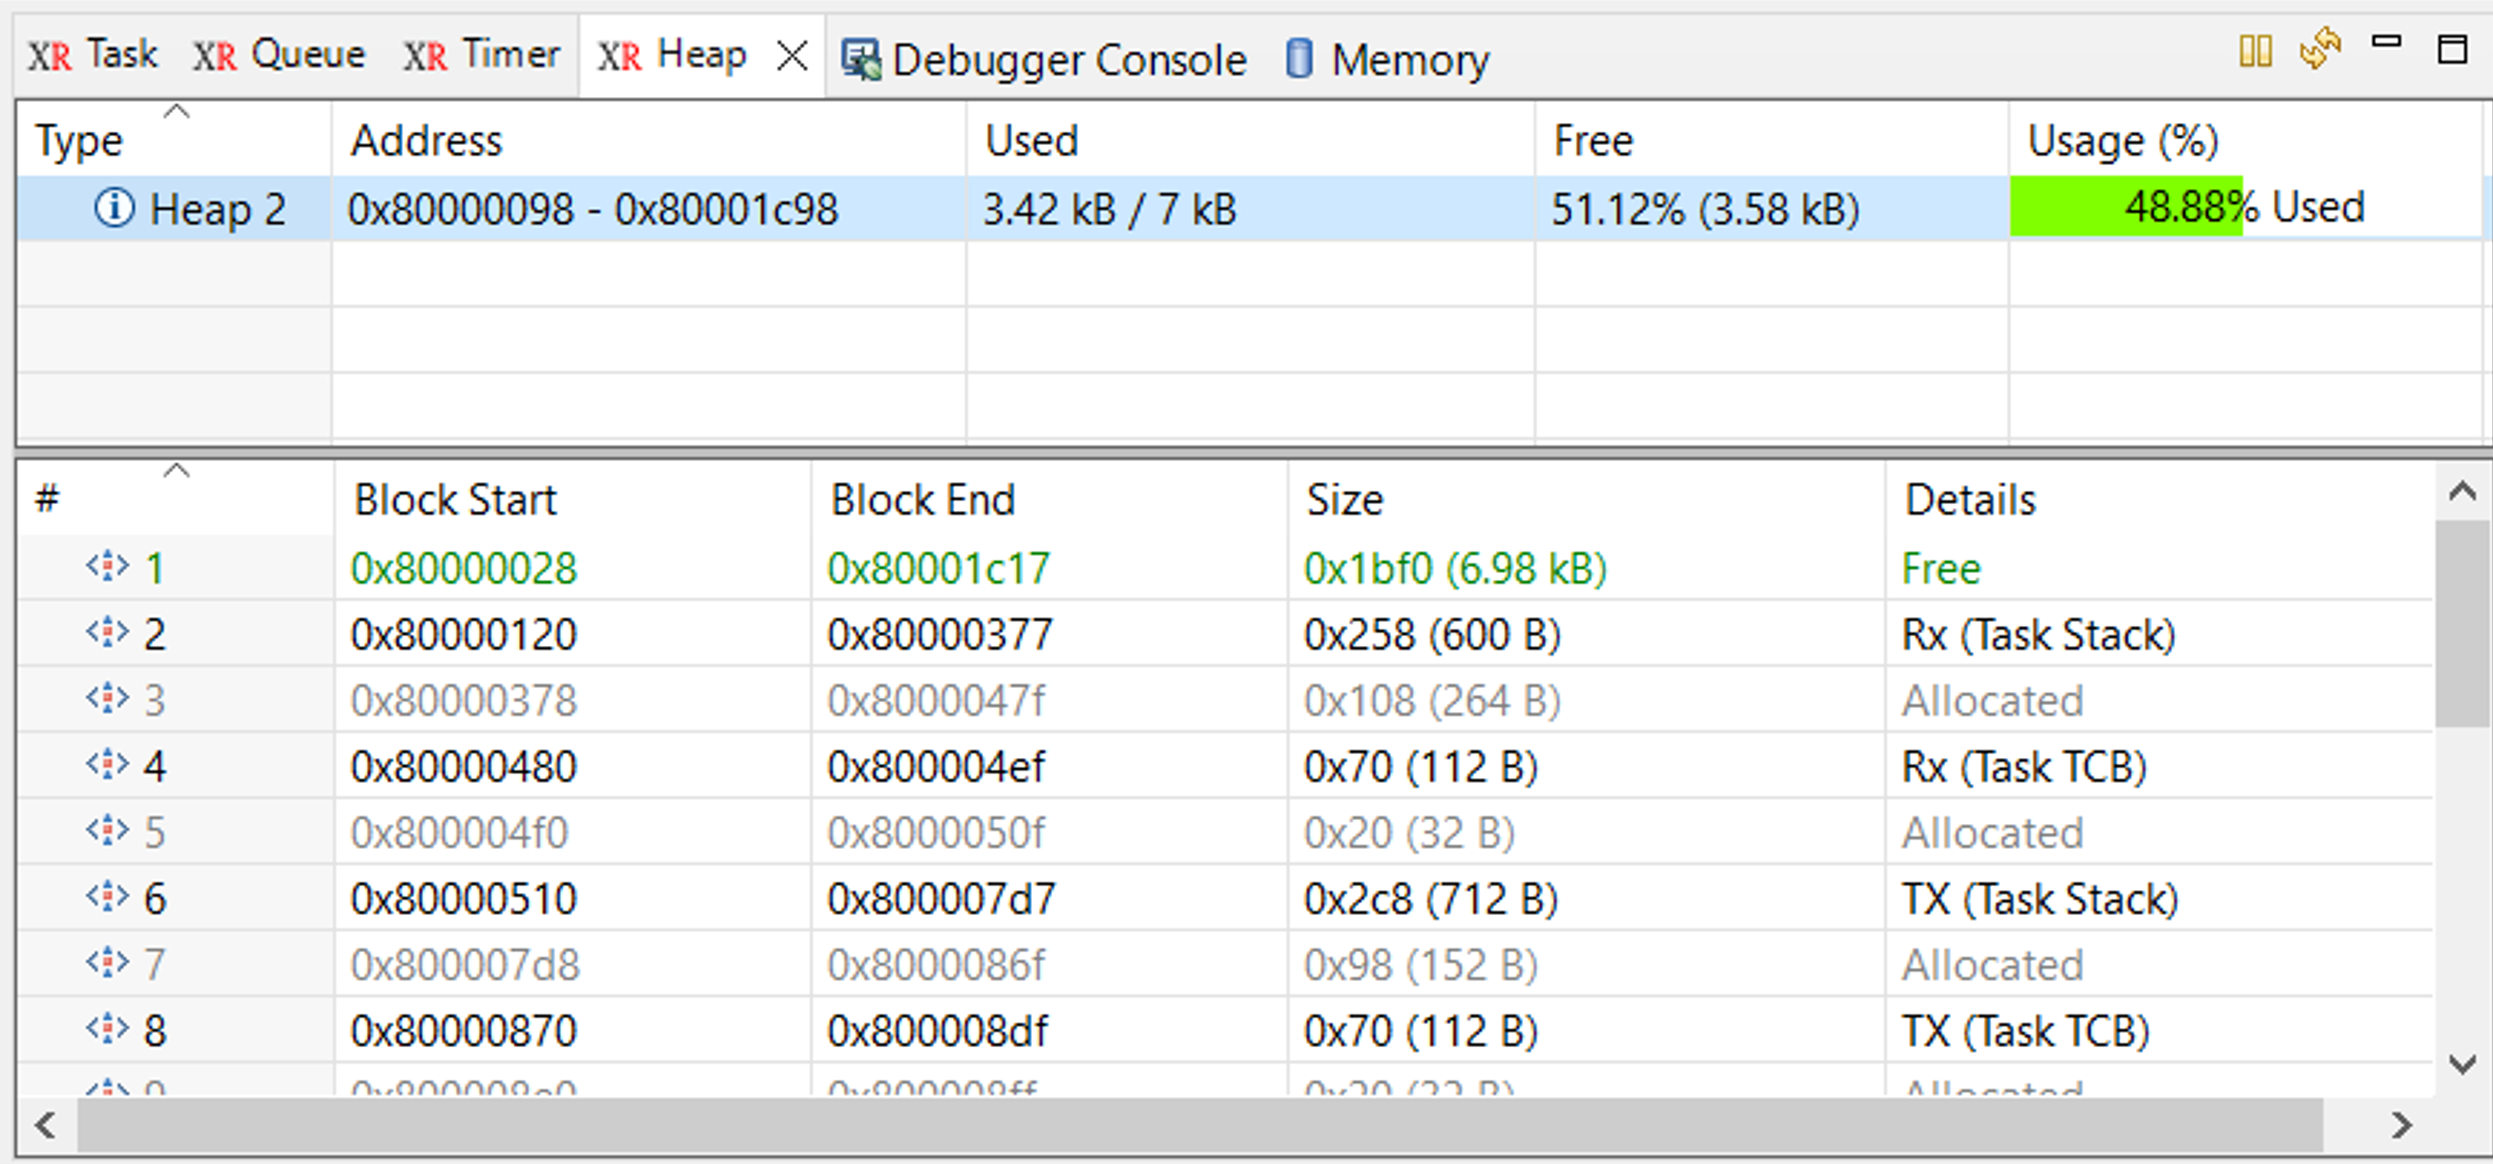
User can open Object Variables, Breakpoints, Task, Queue, and Heap to examine application states:
Variables
Breakpoints:
Task:
Queue:
Timer:
Heap:
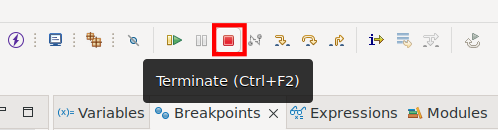
To stop the debug process, click the Terminate icon in the toolbar or press F2.
Feedback
Was this page helpful?
Glad to hear it! Please tell us how we can improve.
Sorry to hear that. Please tell us how we can improve.