Project / Debug views
Note: XploR Studio IDE is based on Eclipse IDE. Therefore, the views and perspectives of XploR Studio IDE are similar to Eclipse IDE. For more information about Eclipse IDE, please refer to Eclipse Platform User Guide.
Console View
The Console view displays program output as well as output from the build tools. The Console view is connected to stdin, stdout, and stderr of the compilation process. An example of Console view output:
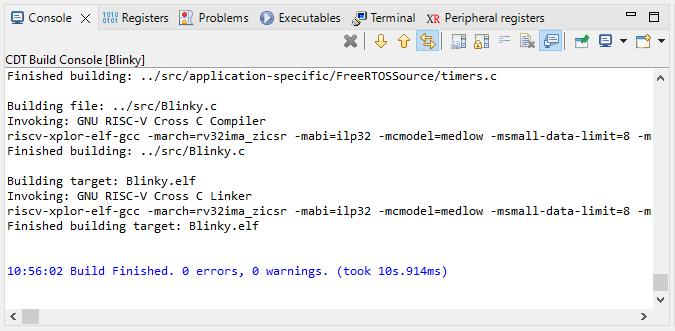
The Console view only represents programs that are running on the host, such as compilers and linkers. Programs running on an external target will display their output in other views, such as a terminal emulator window, depending on the type of target.
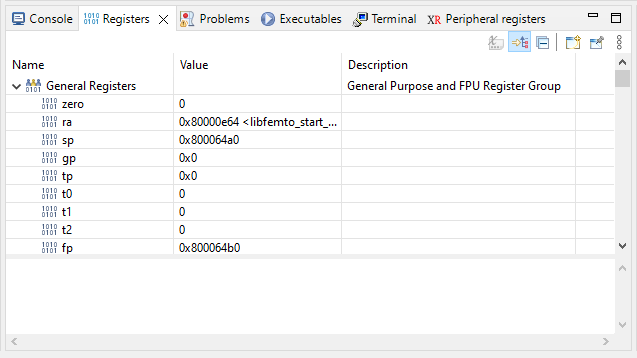
Register View
The Register view displays the contents of the CPU registers. The Register view is connected to the GDB server. An example of Register view output:
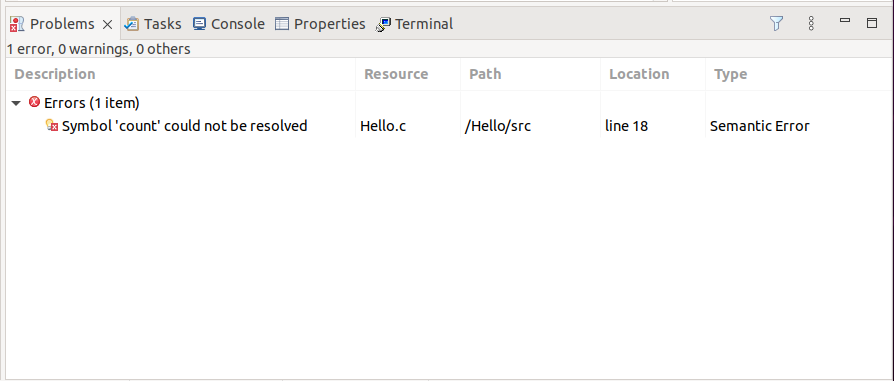
Problems View
The Problems view displays problems detected by the build tools. The Problems view is connected to the build tools. An example of Problems view output:
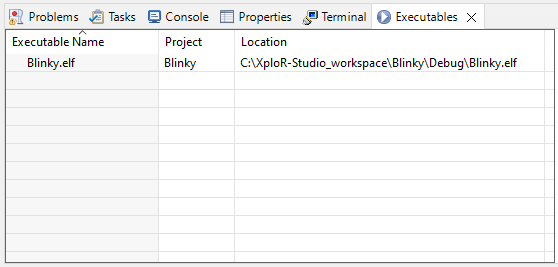
Executables View
The Executables view displays the executables that are part of the current project. The Executables view is connected to the build tools. An example of Executables view output:
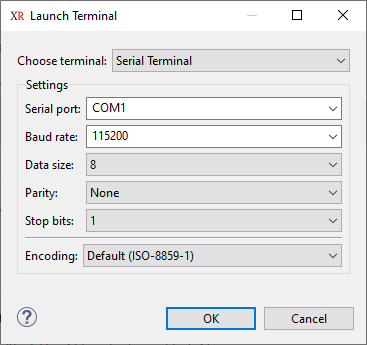
Terminal View
The Terminal view displays a terminal emulator window. The Terminal view is connected to the host machine. An example of Terminal view output:
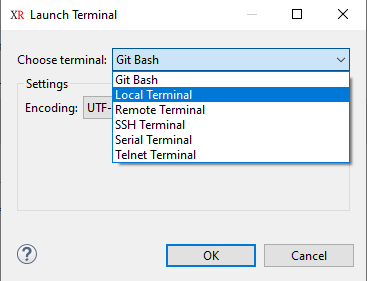
Users can use this Terminal view to open the shell/bash console of the host machine, remote connection, or serial connection to the target platform. For example, with a serial terminal, users can specify additional parameters such as which device to connect, baud rate, and similar.
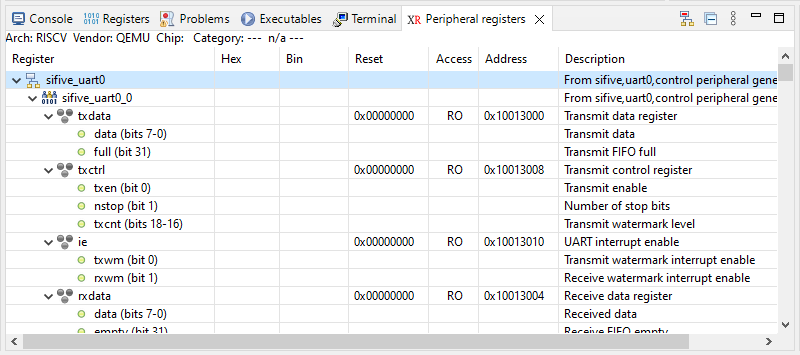
Peripheral Registers View
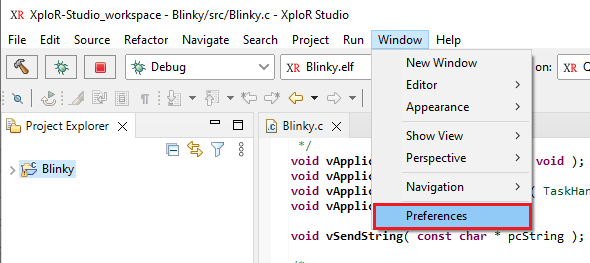
In the complex application where the peripherals are configured with the RISC-V cores, users can examine the peripherals’ status such as control register values, and data register values via the Peripheral Registers View. The Peripherals Registers View lists all peripherals available in the device hardware description .SVD file provided by the silicon vendor. To active Peripheral registers view, select Window > Preferences.
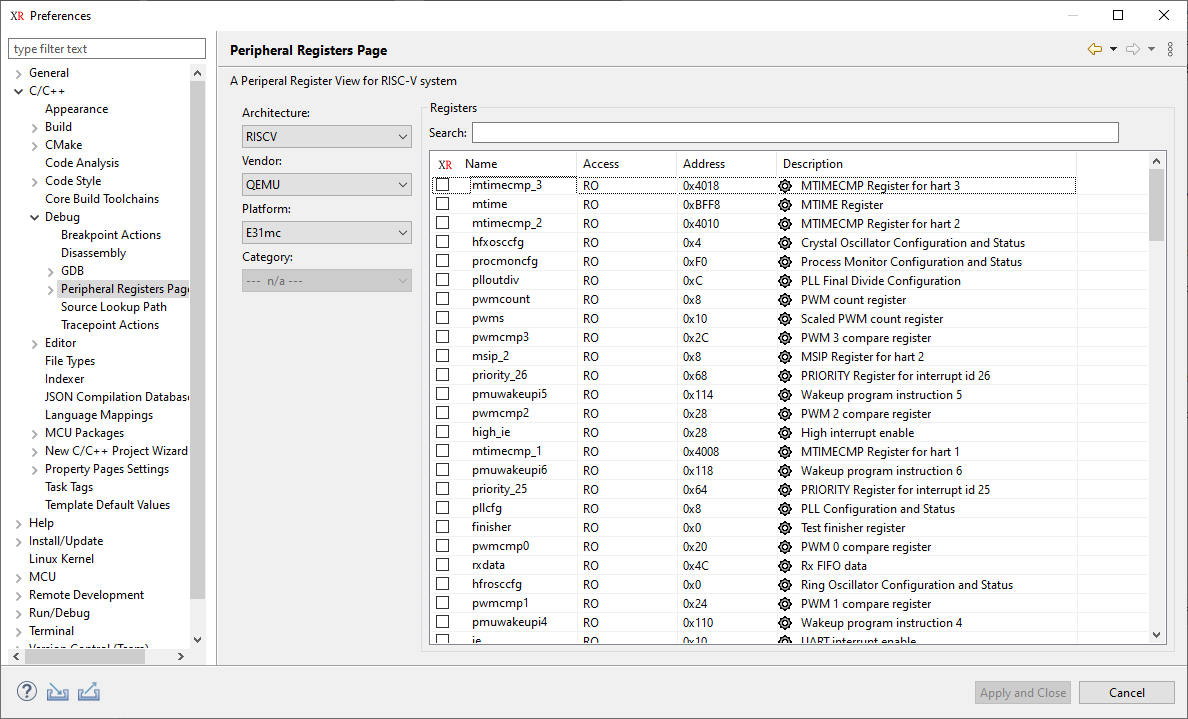
Then select C/C++ > Debug section Click Peripheral Registers Page. On this page:
- Architecture: Select RISC-V
- Vendor: Select QEMU
- Platform: Select Spike or E31mc or E31
The peripheral registers will be listed on the right-hand side of the page:
Users can select registers or all registers to check, then click Apply and Close button.
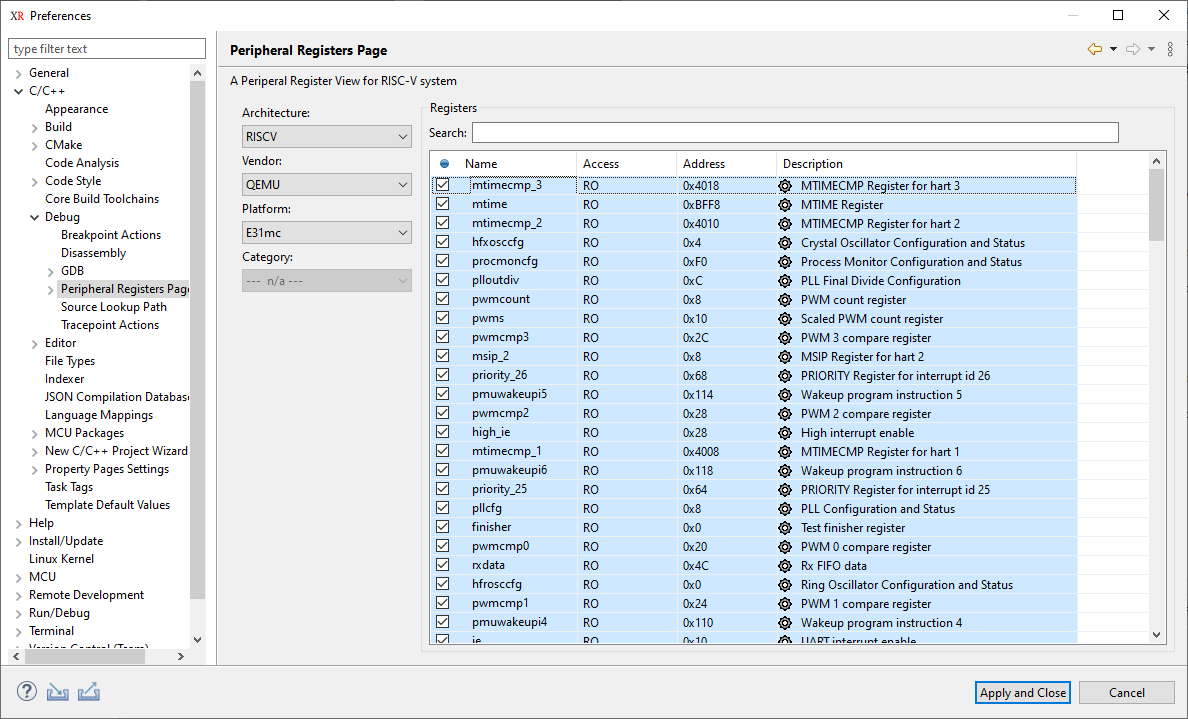
The Peripheral register views will show all registers and their status.
Adding Peripheral files to Peripheral Registers View
Create a new folder within the XPLOR_HOME directory.
Include the .metadata file in the newly created folder, using the following sample content:
<?xml version="1.0" encoding="UTF-8"?>
<?eclipse version="3.4"?>
<plugin>
   <extension
         point="xplor.studio.regview.peripheralData">
      <peripheral
            architecture="RISCV"> <!-- architecture name -->
         <vendor
               name="FPGA"> <!-- vendor name -->
            <chip
                  id="neorv32"
                  path="/path_to_svd_file/neorv32.xml"> <!-- The file path must exist -->
            </chip>
         </vendor>
      </peripheral>
   </extension>
</plugin>
- Proceed to restart the XploR Studio application. After the restart, navigate to the Peripheral Registers Page to access the newly available Architecture/Vendor/Platform options.
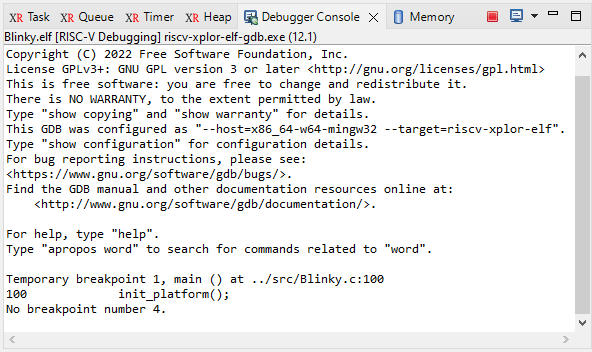
Debugger Console View
The Debugger Console view displays the output from the GDB server. This view is useful for debugging the GDB server itself. The Debugger Console view is connected to stdin, stdout, and stderr of the GDB server process. An example of Debugger Console view output:
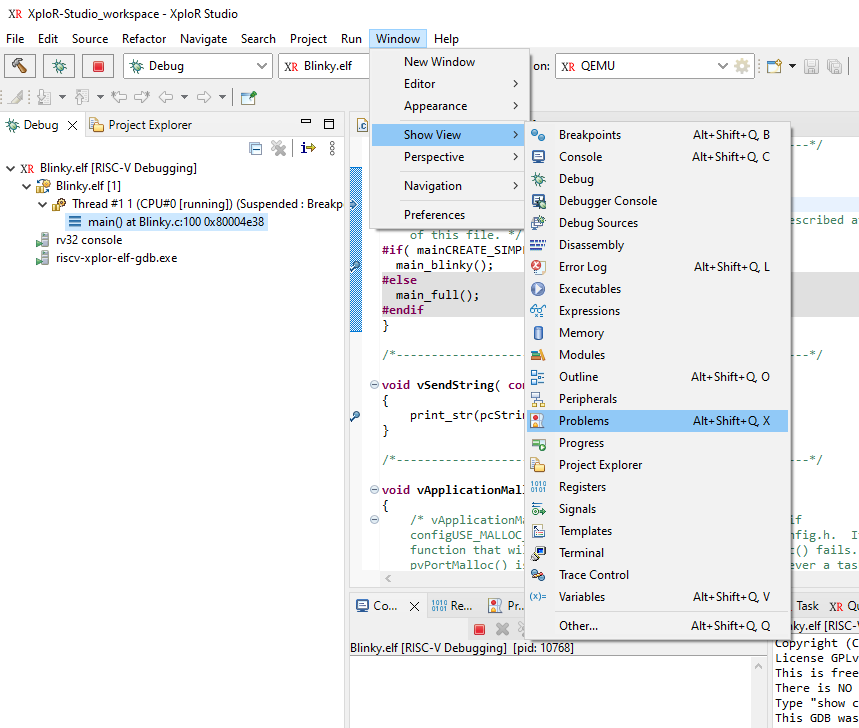
Note: If any of view disappears, users can always restore by clicking *Window > Show View/NAME_OF_VIEW.
Feedback
Was this page helpful?
Glad to hear it! Please tell us how we can improve.
Sorry to hear that. Please tell us how we can improve.