LTTng Trace Control Linux Project
This chapter covers the basics of C/C++ LTTng Trace Control Linux Project projects, including create/build/run/debug applications. This application sets up some tracepoints for tracing purposes when running the application. The application can also be built and run on QEMU emulator.
Components Prerequisites
To build, run and debug LTTng Trace Control Linux Project applications, please make sure that all below components are installed. Please refer to Component management for more information about installing component.
- xplor-studio-tracecompass-plugin: Contains scripts to install Eclipse Tracecompass into XploR Studio
- xplor-studio-linux-debug-plugin: Kernel XploR Studio Plugin using for kernel debugging
- rv-linux-rootfs: RISC-V RootFS can be booted by QEMU and can run/debug RISC-V Embedded Linux applications
- rv-qemu-linux64/rv-qemu-win64: QEMU for running and debugging RISC-V applications (Baremetal, Embedded, Embedded Linux)
- linux-lttng-trace-example: LTTng Trace Control Linux Project source code.
All above components are compulsory for running Embedded Linux Trace Control applications. Depending on variation of toolchain, XploR Studio has 2 different Linux toolchain components:
- rv64imac-xplor-linux-linux64/rv64imac-xplor-linux-win64: RISC-V Embedded Linux toolchain 64-bit (No Float)
- rv64gc-xplor-linux-linux64/rv64gc-xplor-linux-win64: RISC-V Embedded Linux toolchain 64-bit (Double)
Each toolchain can be downloaded separately.
Creating & Building project
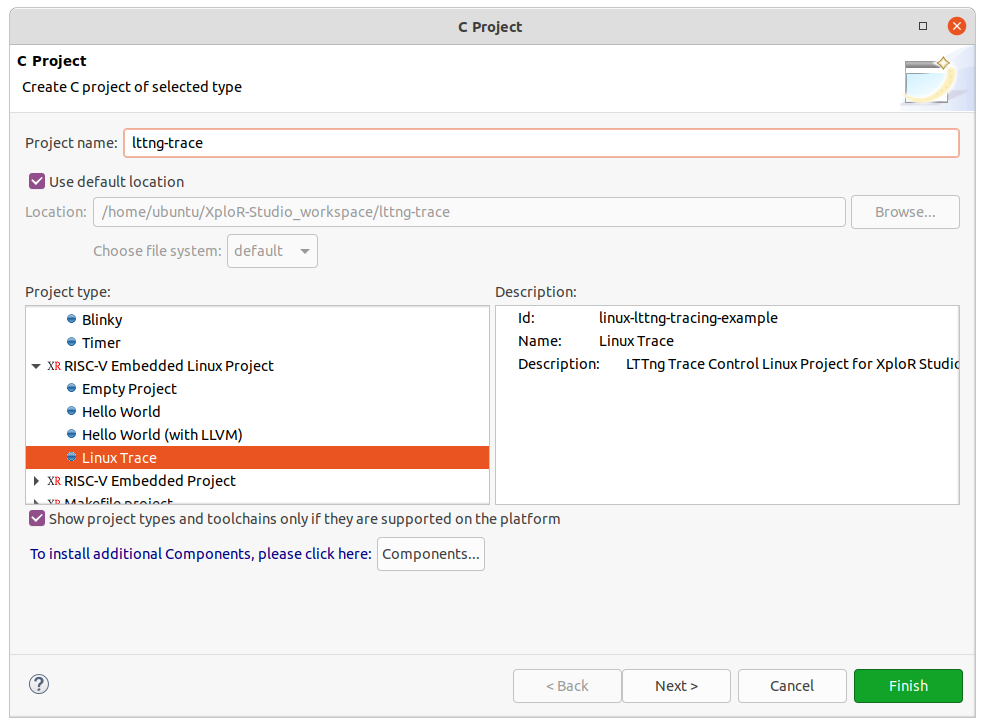
- To create a new project, select File > New > C Project choose RISC-V Embedded Linux Project > Linux Trace
- Other steps (building project) are same as the quick-start project. Please refer to Quick start with FreeRTOS project for general working flow.
Tracing flow
Booting Linux
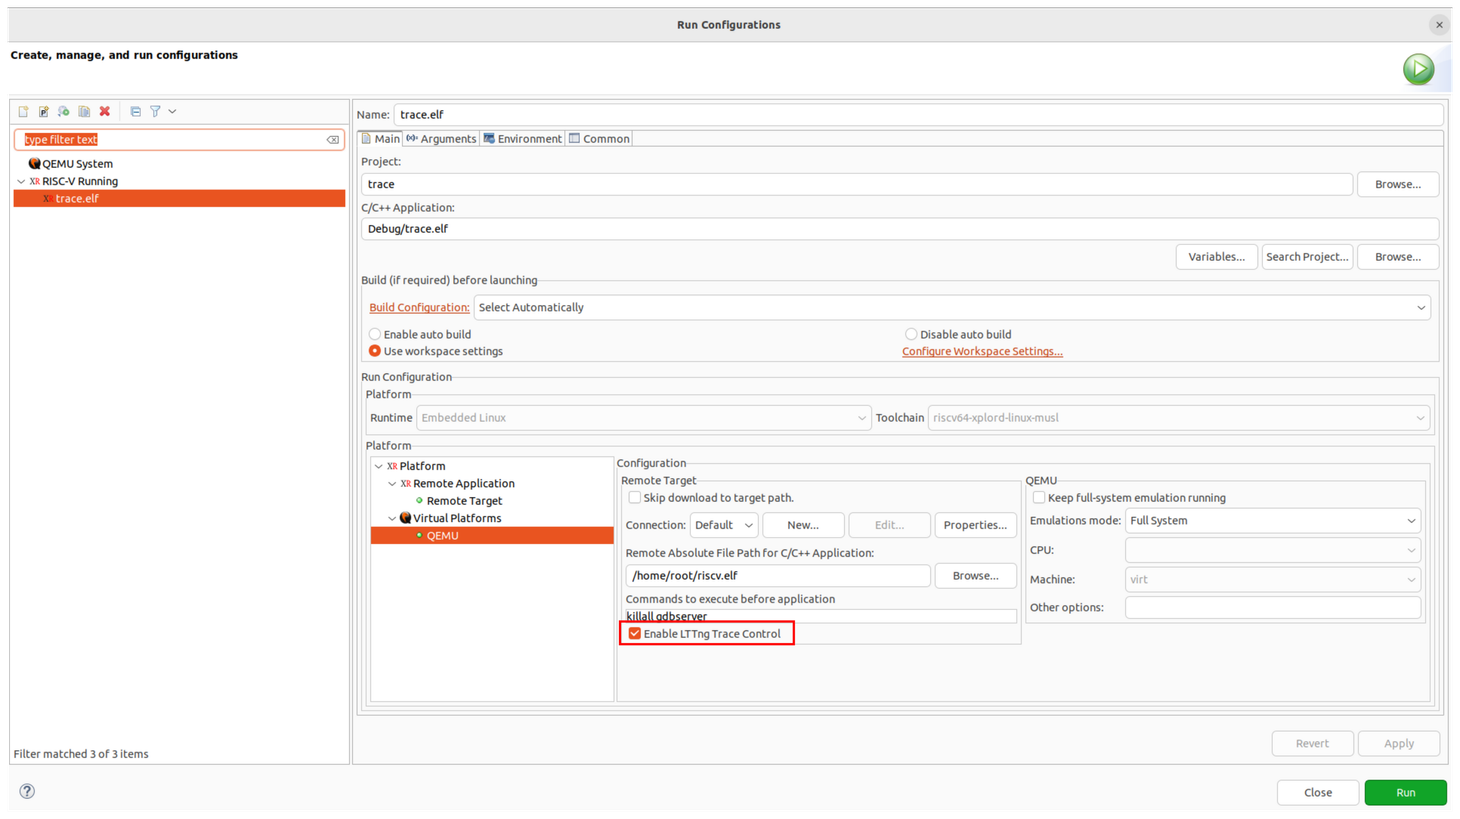
Right-click on project name > Run configurations > RISC-V Running > QEMU:
In Remote Absolute File Path for C/C++ Application: Type /home/root/riscv.elf (if missing)
Click on Enable LTTng Trace Control checkbox
Choose Apply and Run
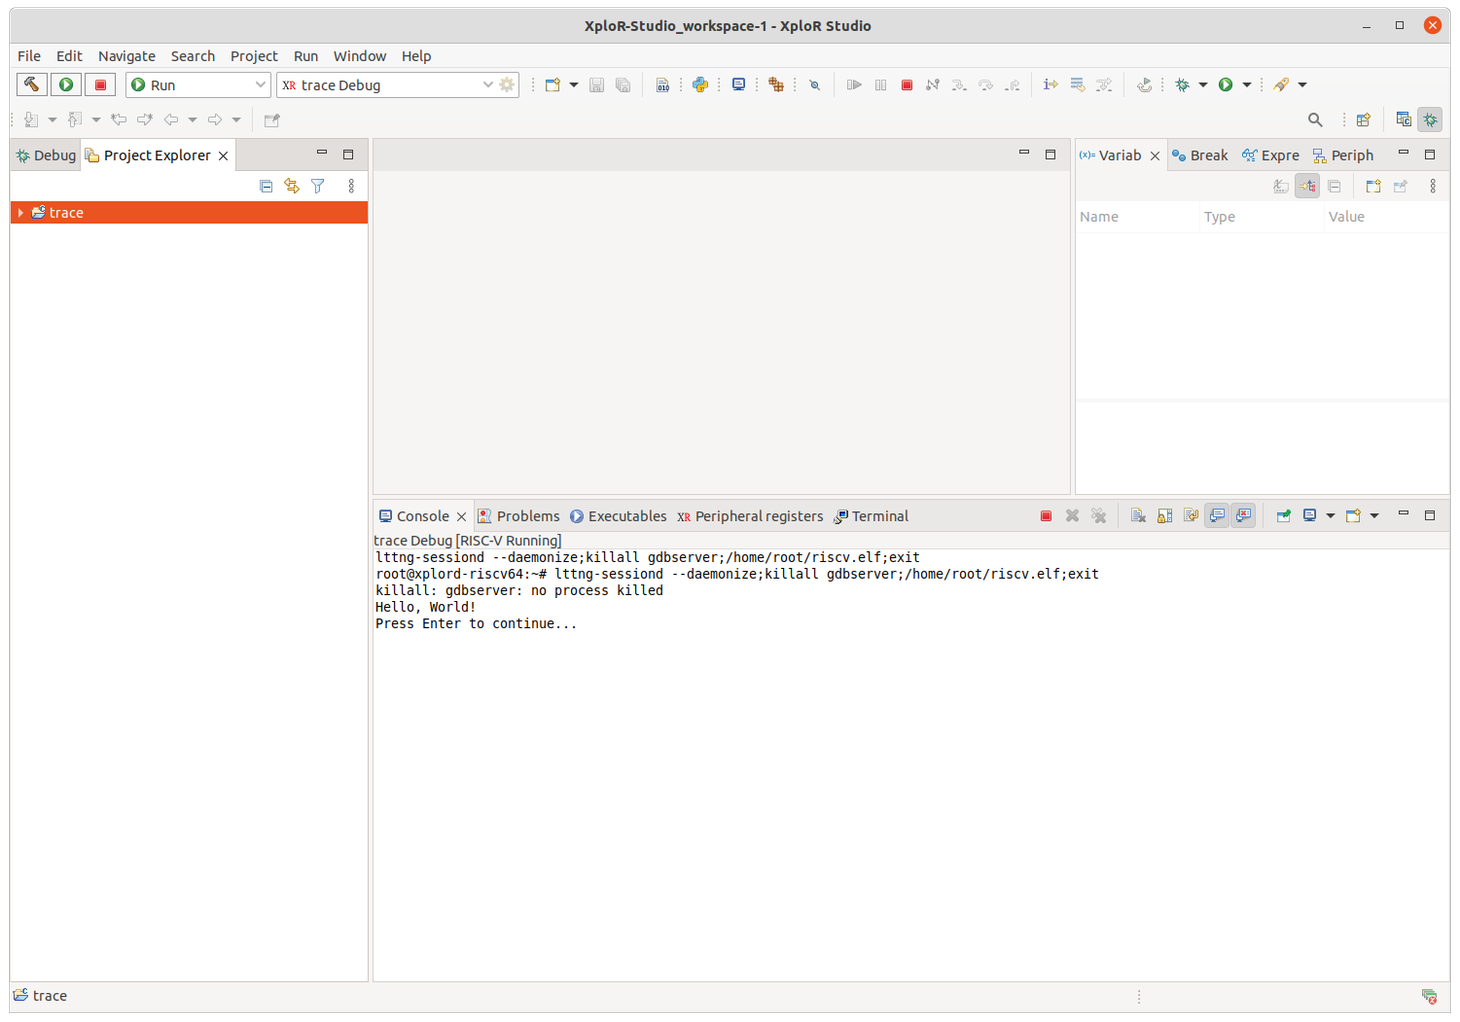
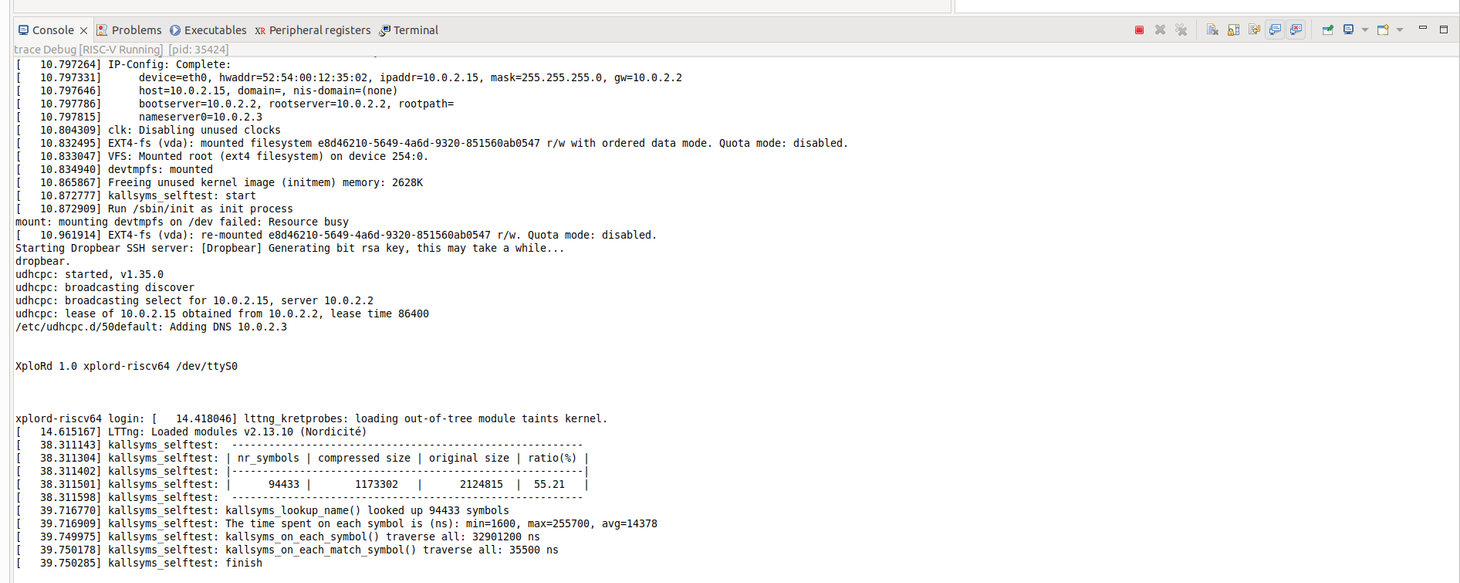
Wait a few minutes for QEMU booting Linux:
Starting Trace session
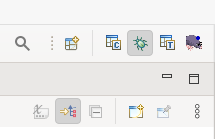
Now we can start the Trace session by clicking on this button (in the top-right corner):
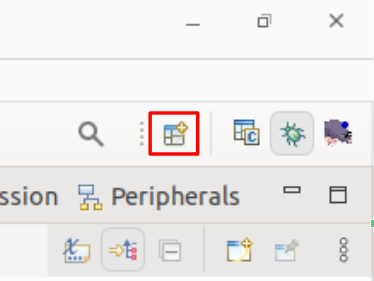
and select LTTng Kernel and Open:
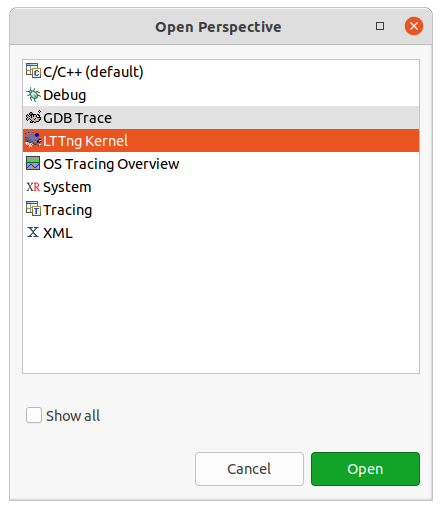
The screen should be like this:
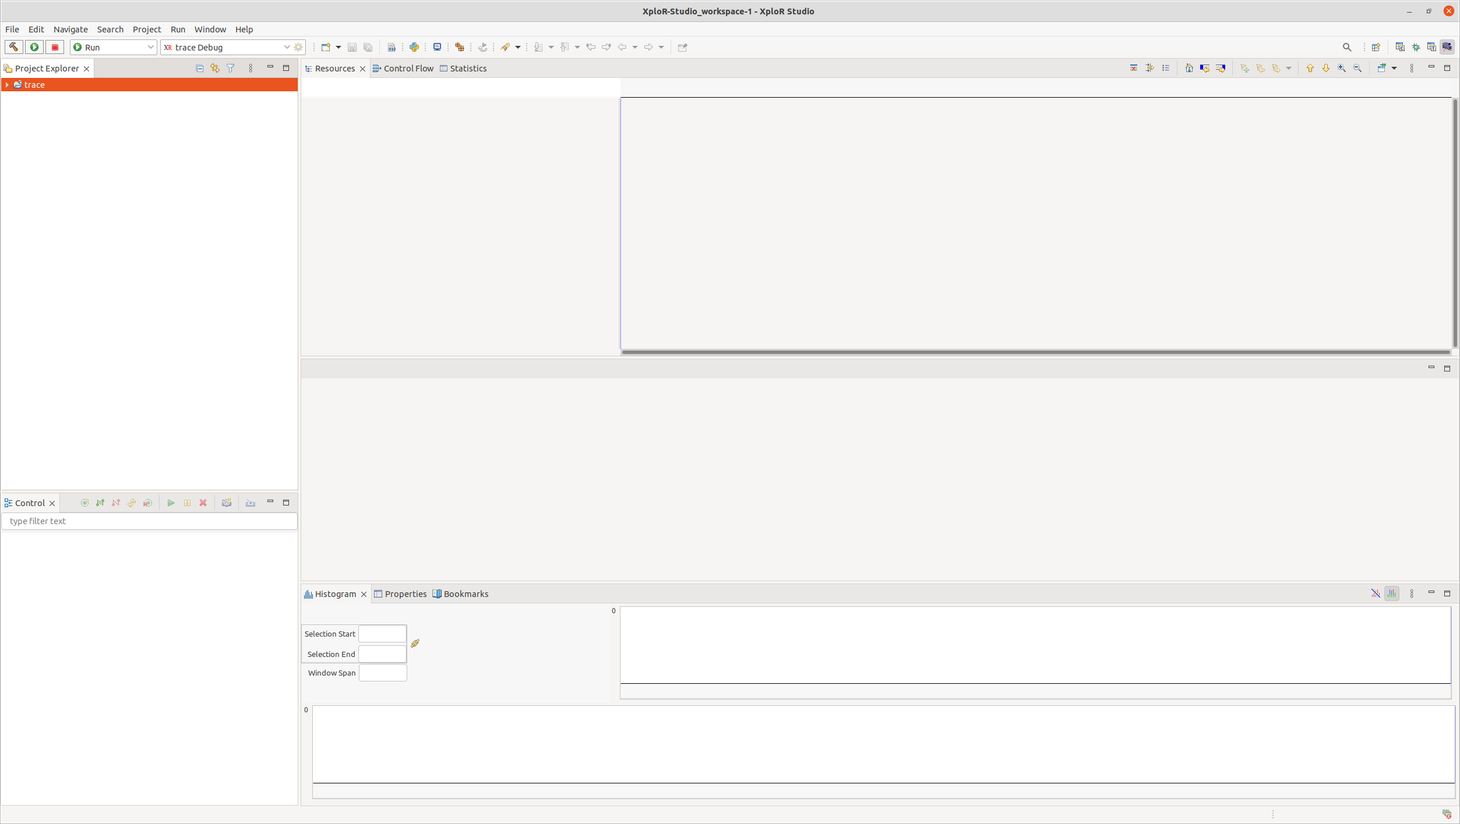
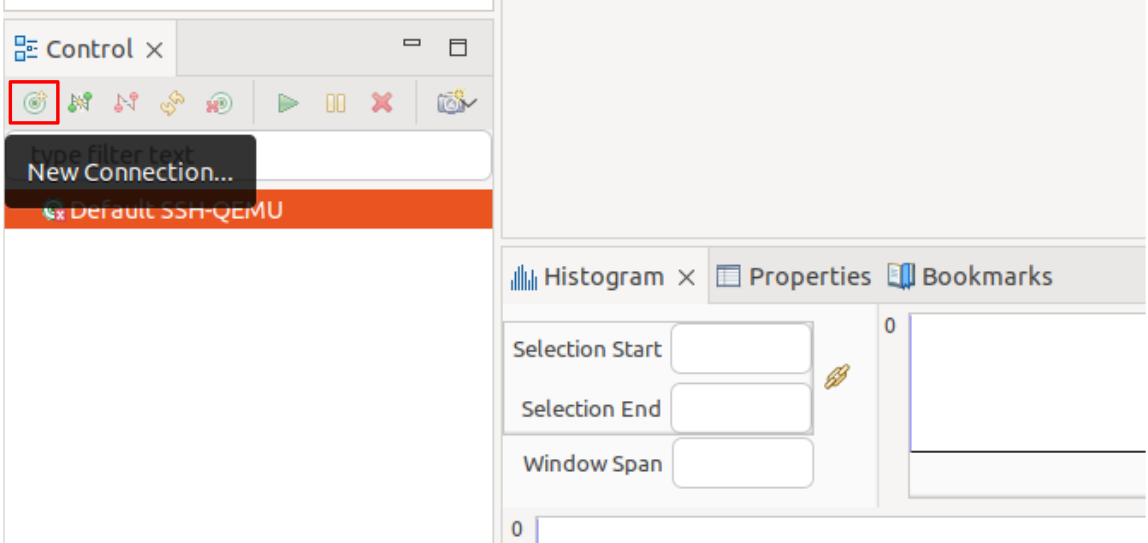
In left corner, in Control tabs:
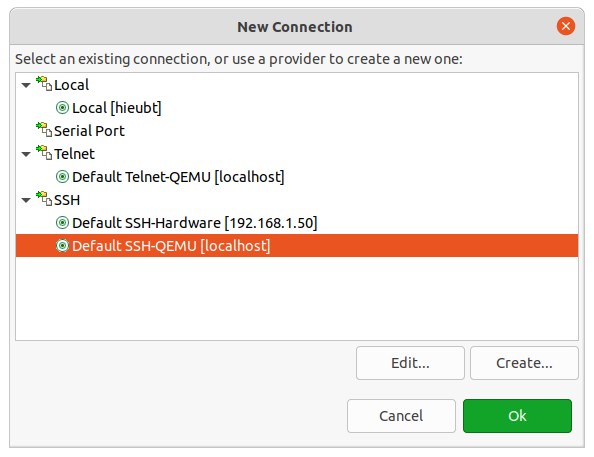
Create New Connection…
Select Default SSH-QEMU [localhost]:
Select Edit…:
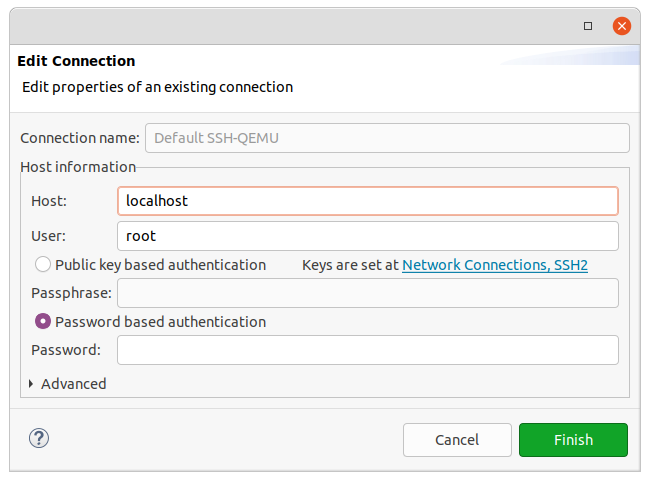
Host: localhost
User: root
Password based authentication
Then Finish and OK
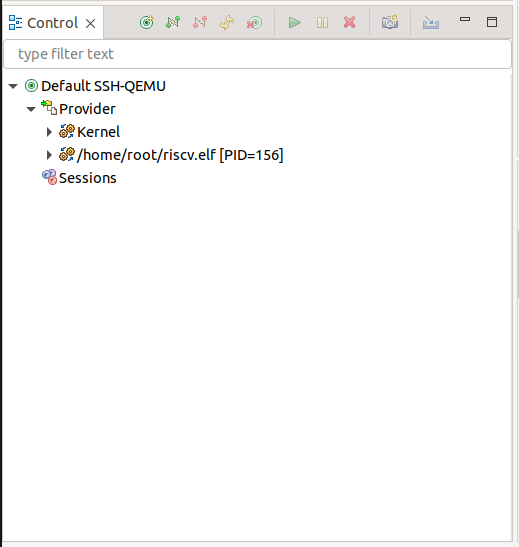
Now the Control View shows:
Right-click on Sessions and select Create sessions:
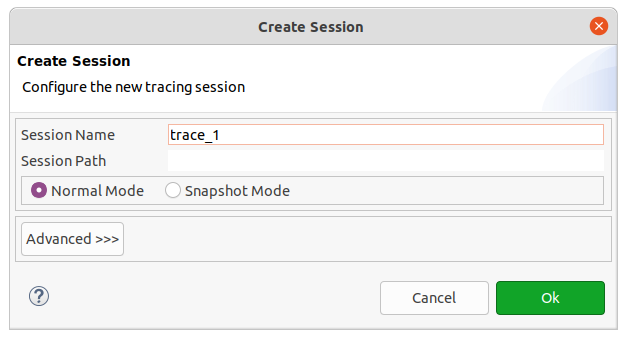
Enter Session Name
Choose Normal Mode and OK:
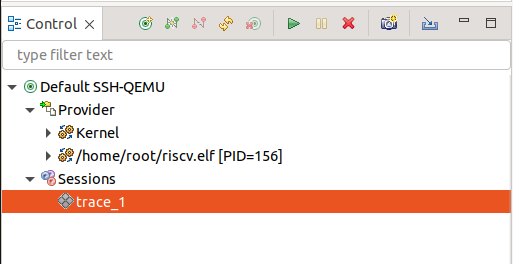
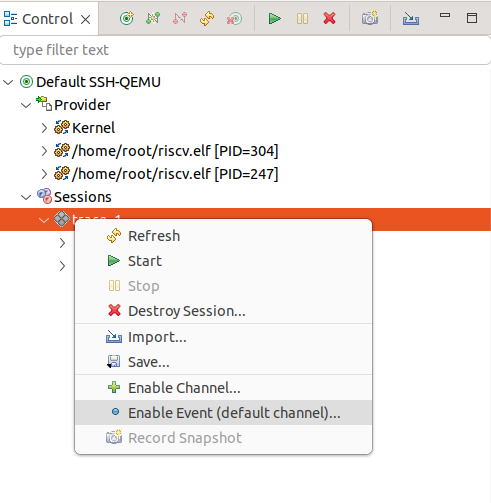
After create session, we can enable Kernel or UST event by Right-click on trace_1 > select Enable Event
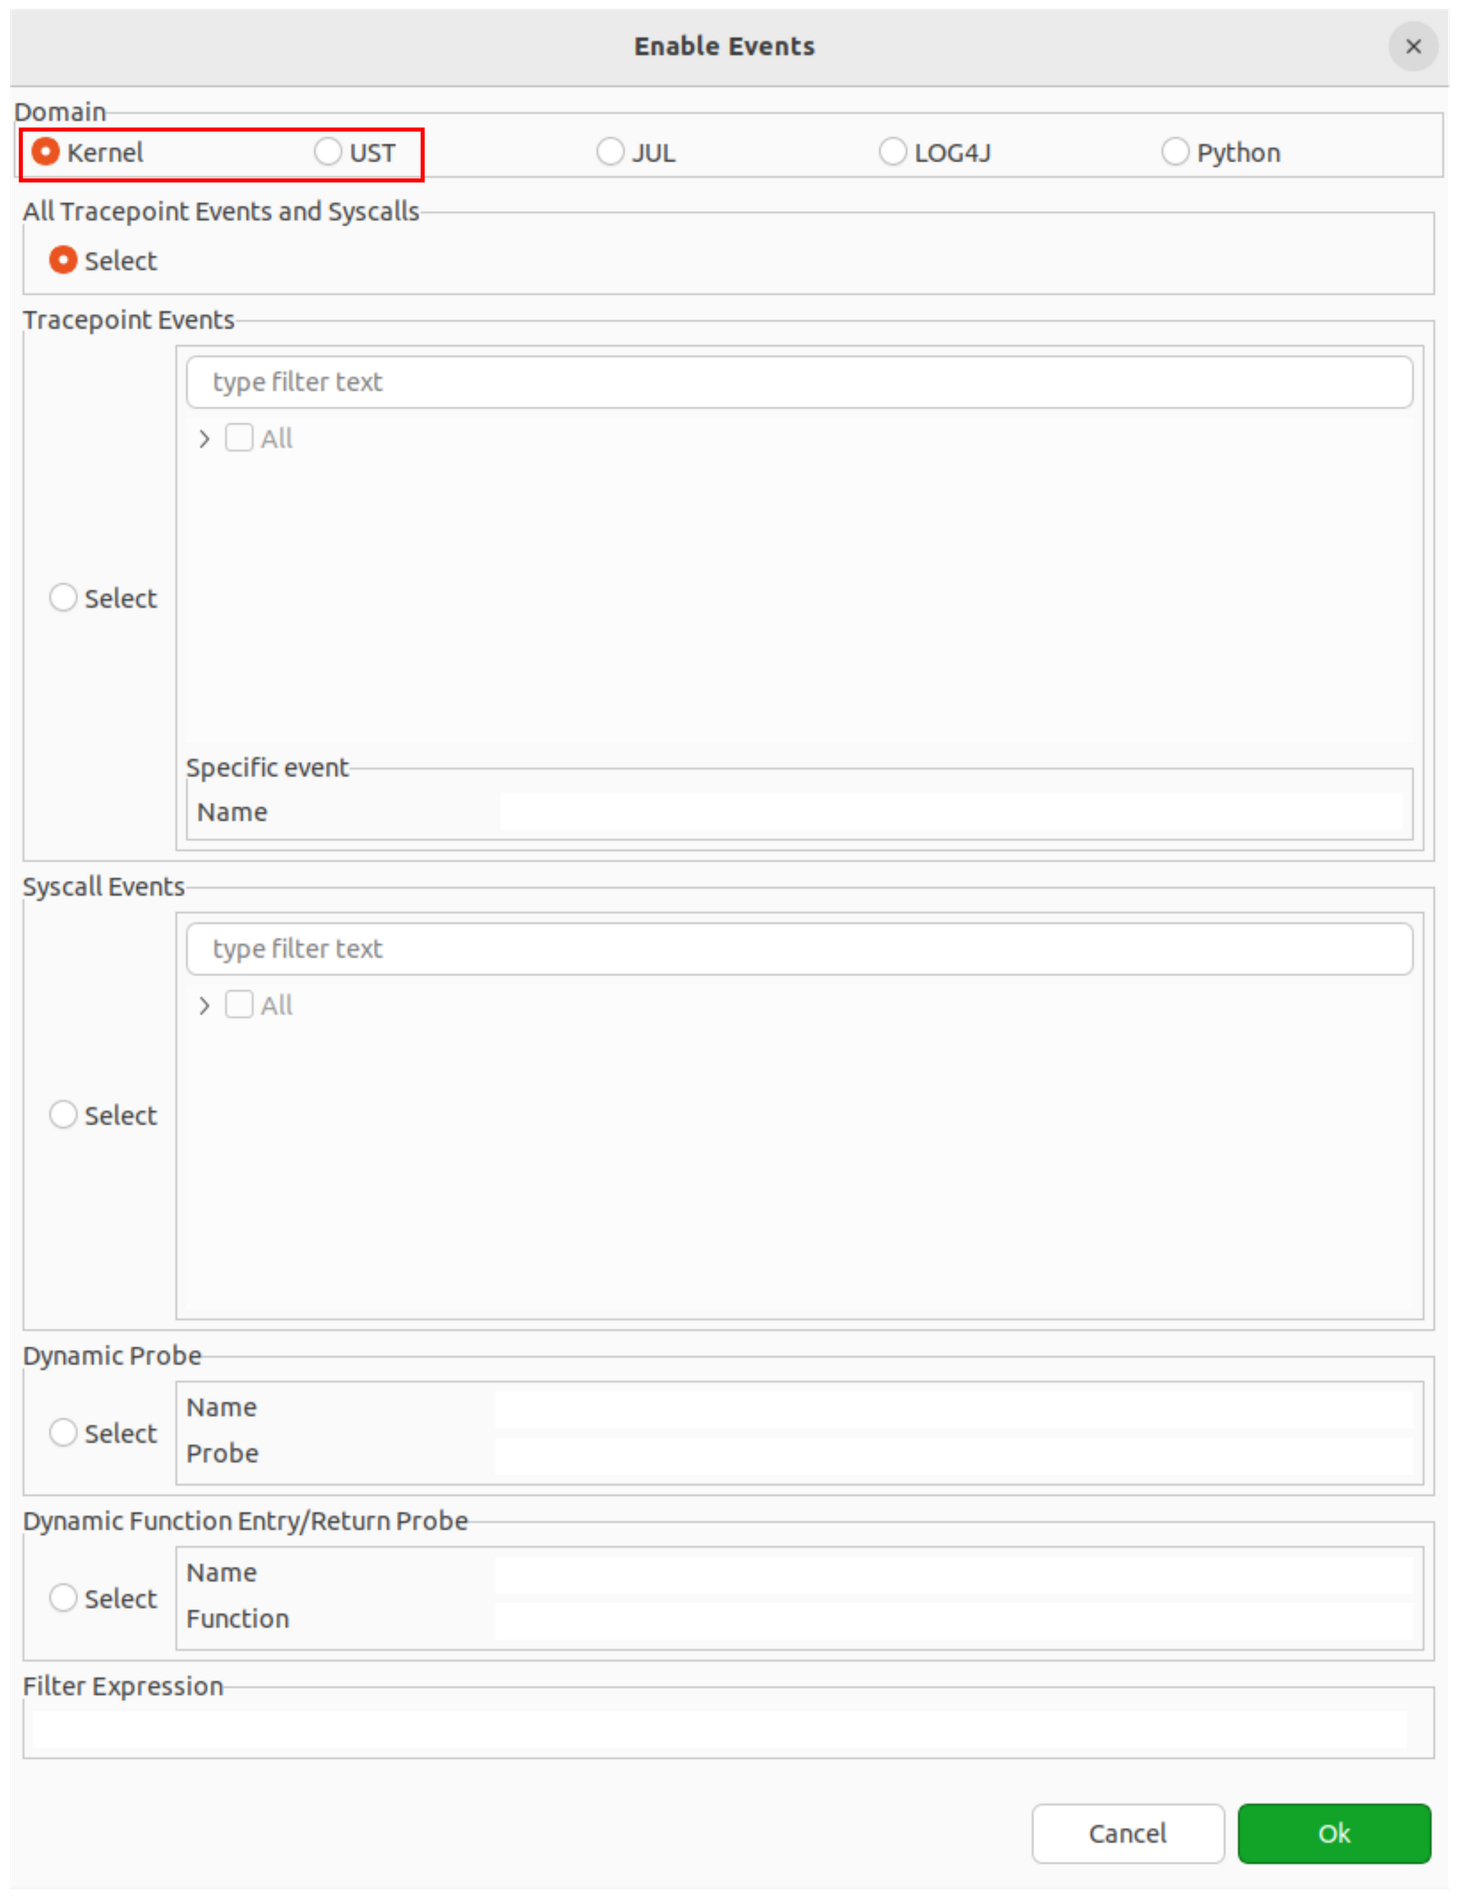
The Enable Events will be shown:
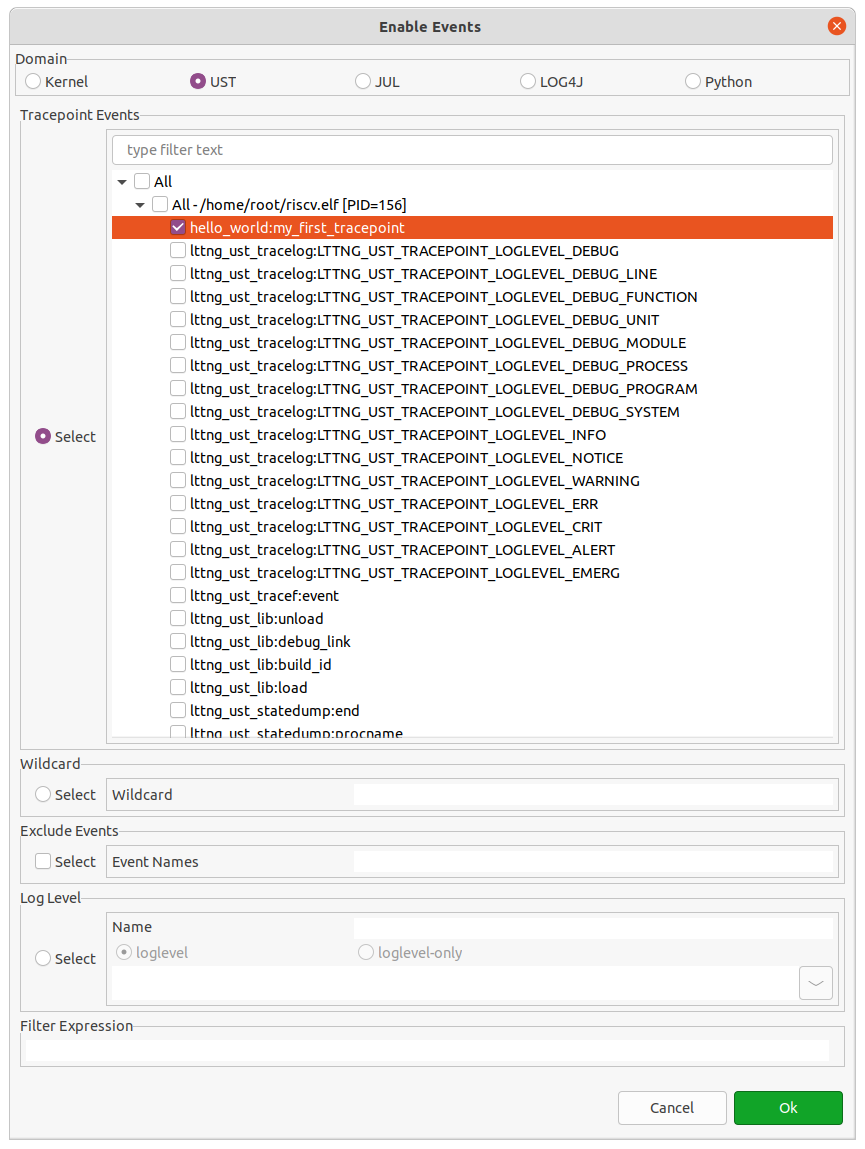
Enable event with UST. Select UST (on Domain) > Select All Tracepoint Events or choose a event (For example: hello_world:my_first_tracepoint)
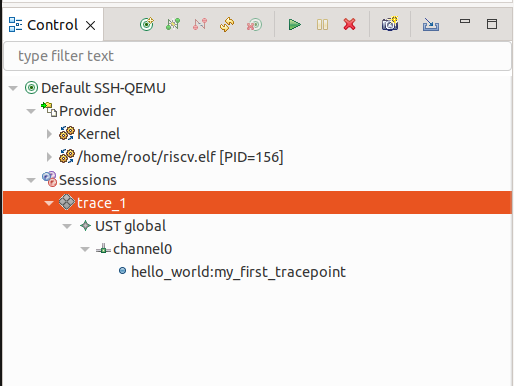
In Control View, information will be displayed in form of a tree structure as follow:
Enable event with Kernel. Select Kernel (on Domain) → Select All Tracepoint Events
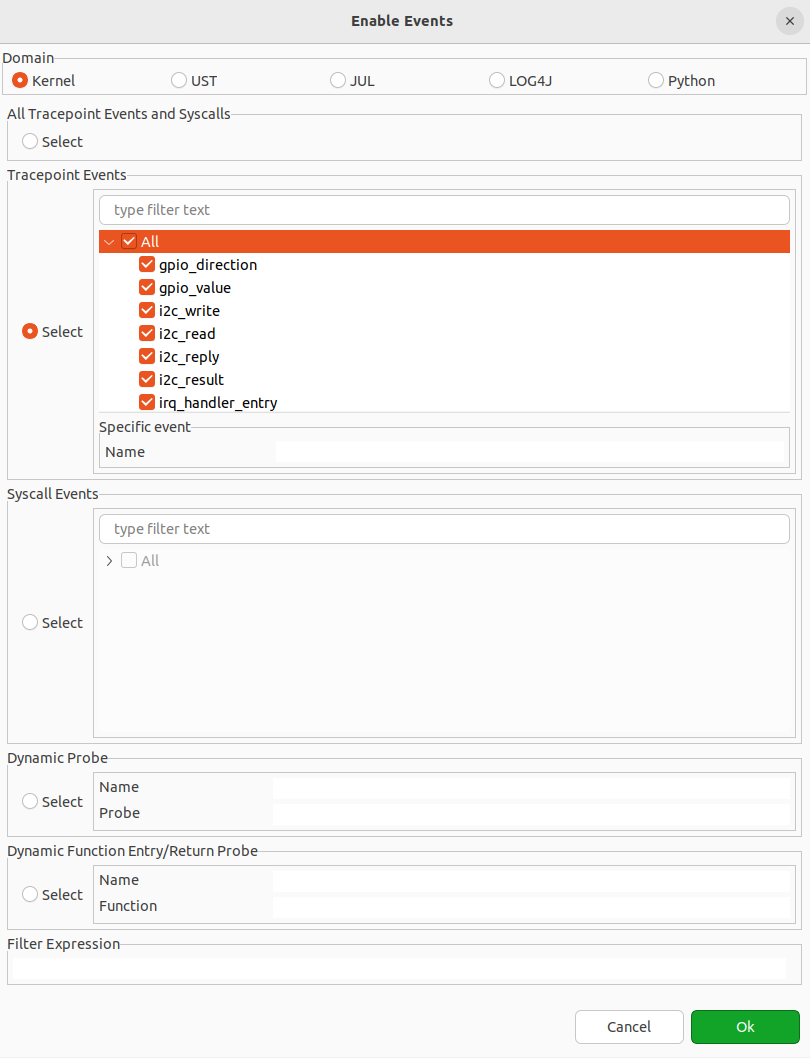
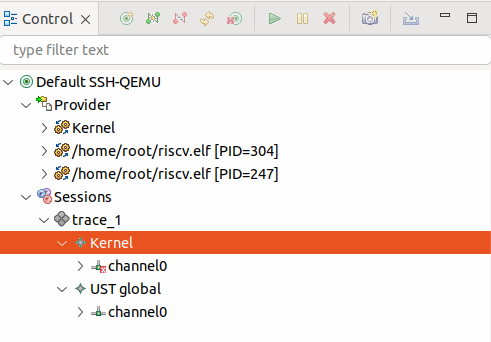
In Control View, information will be displayed in form of a tree structure as follow:
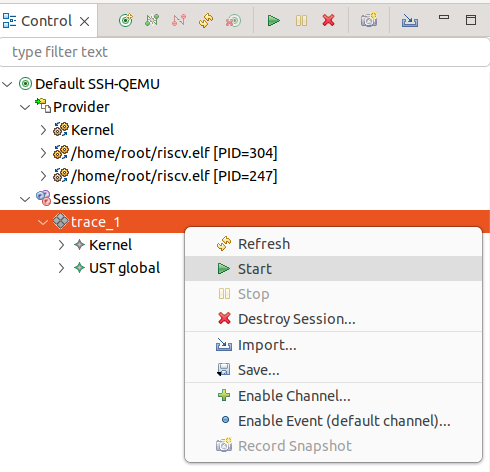
Now you can start the Trace session:
Right-click on trace_1 and select Start:
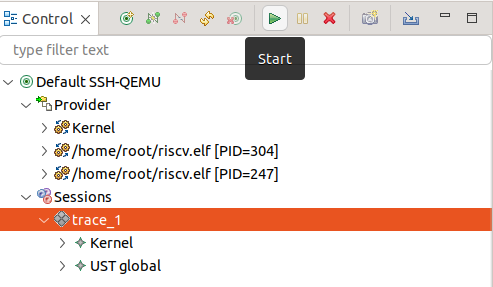
Or click the Start button in the toolbar:
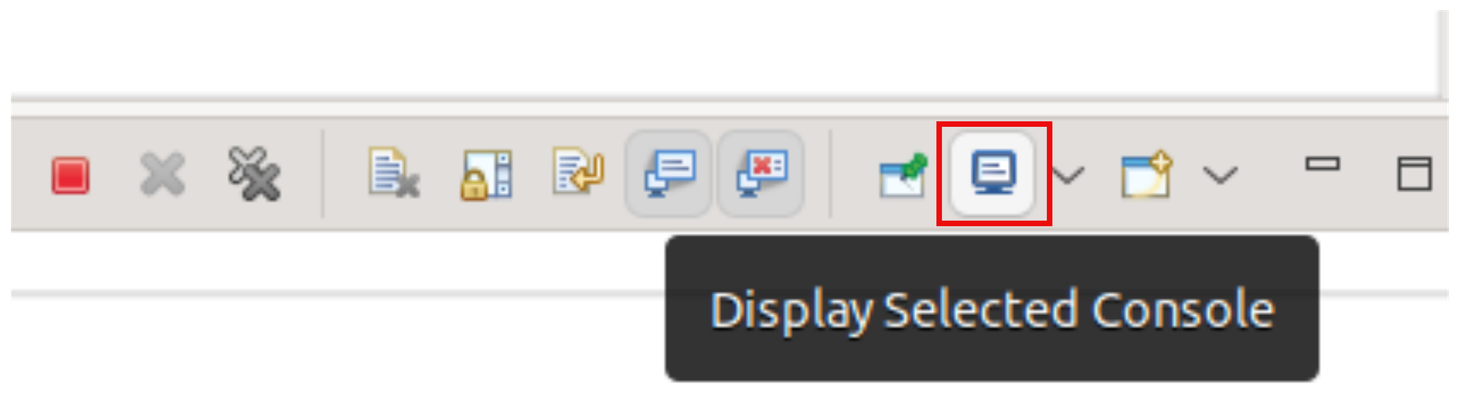
Then change to Debug session by clicking on top-right button:
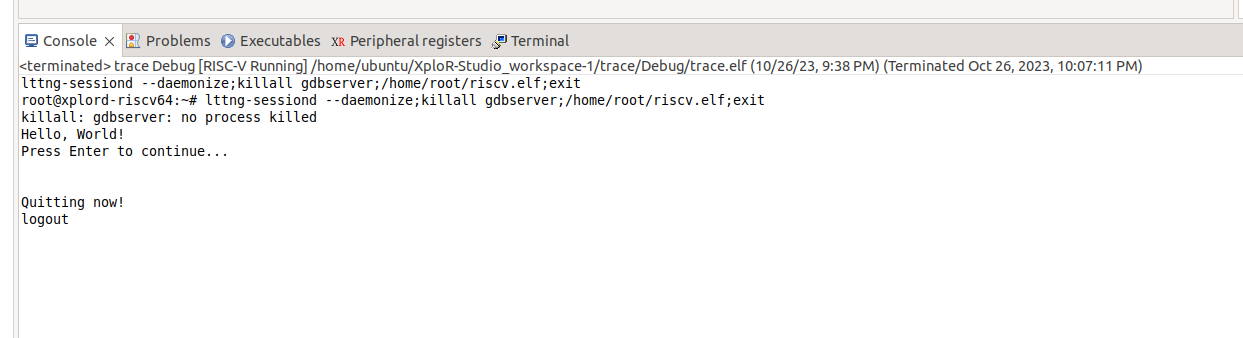
The Console will be like this:
Change to the session that are running QEMU by click on below the button:
You should get something like this:
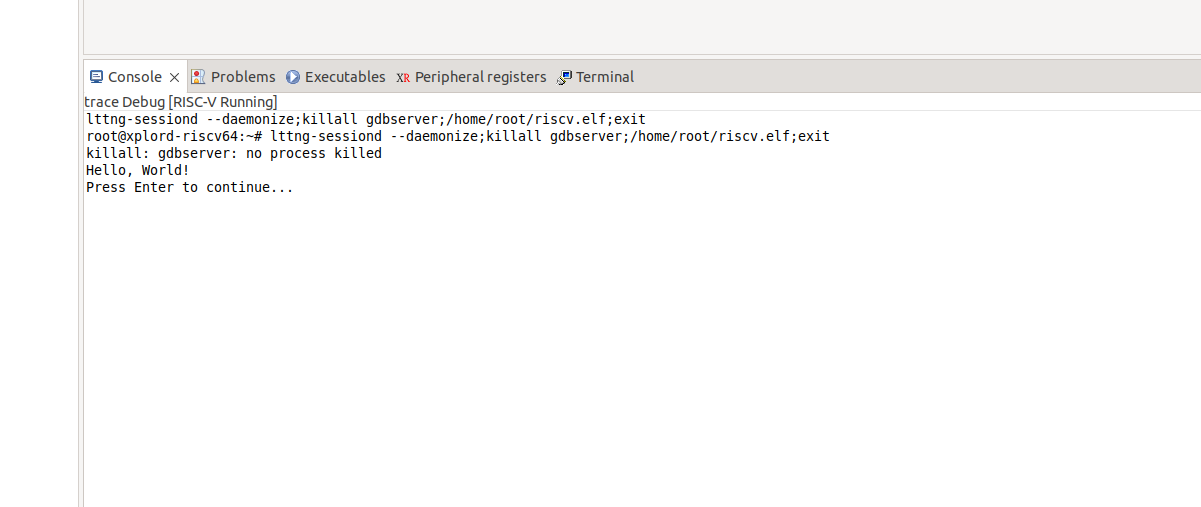
Click on the line Press Enter to continue, and press Enter:
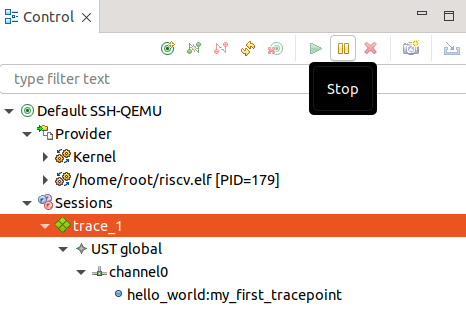
Now back to LTTng Trace sessions and stop Trace
By right-click on trace_1 and choose Stop
Or click on the Stop button
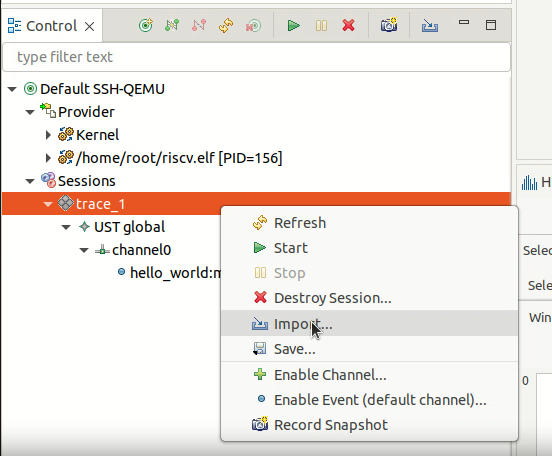
Export and Import Trace Data to view and analyze
Userspace Trace (UST)
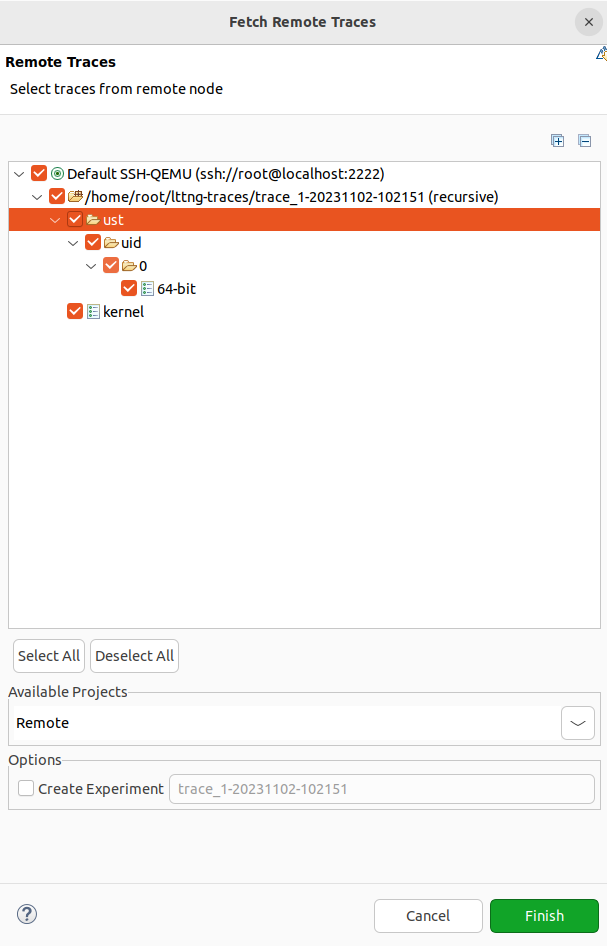
Right-click on trace_1 and select Import:
Select the data is created and click Finish:
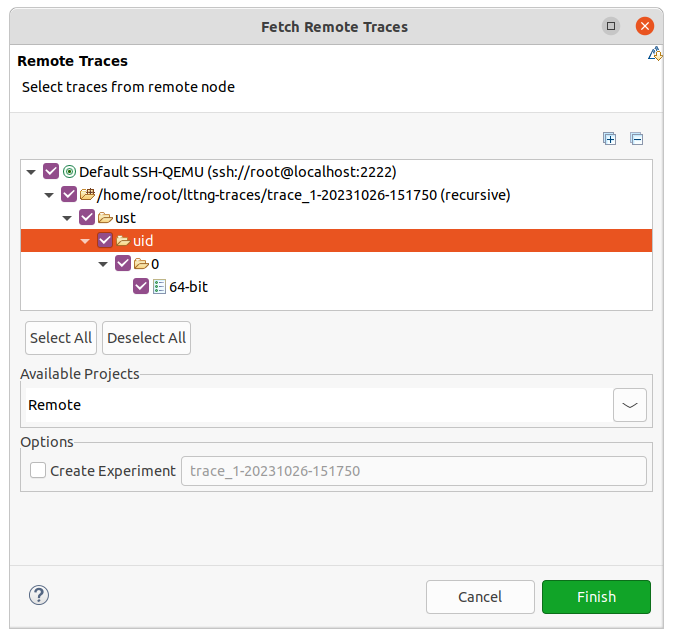
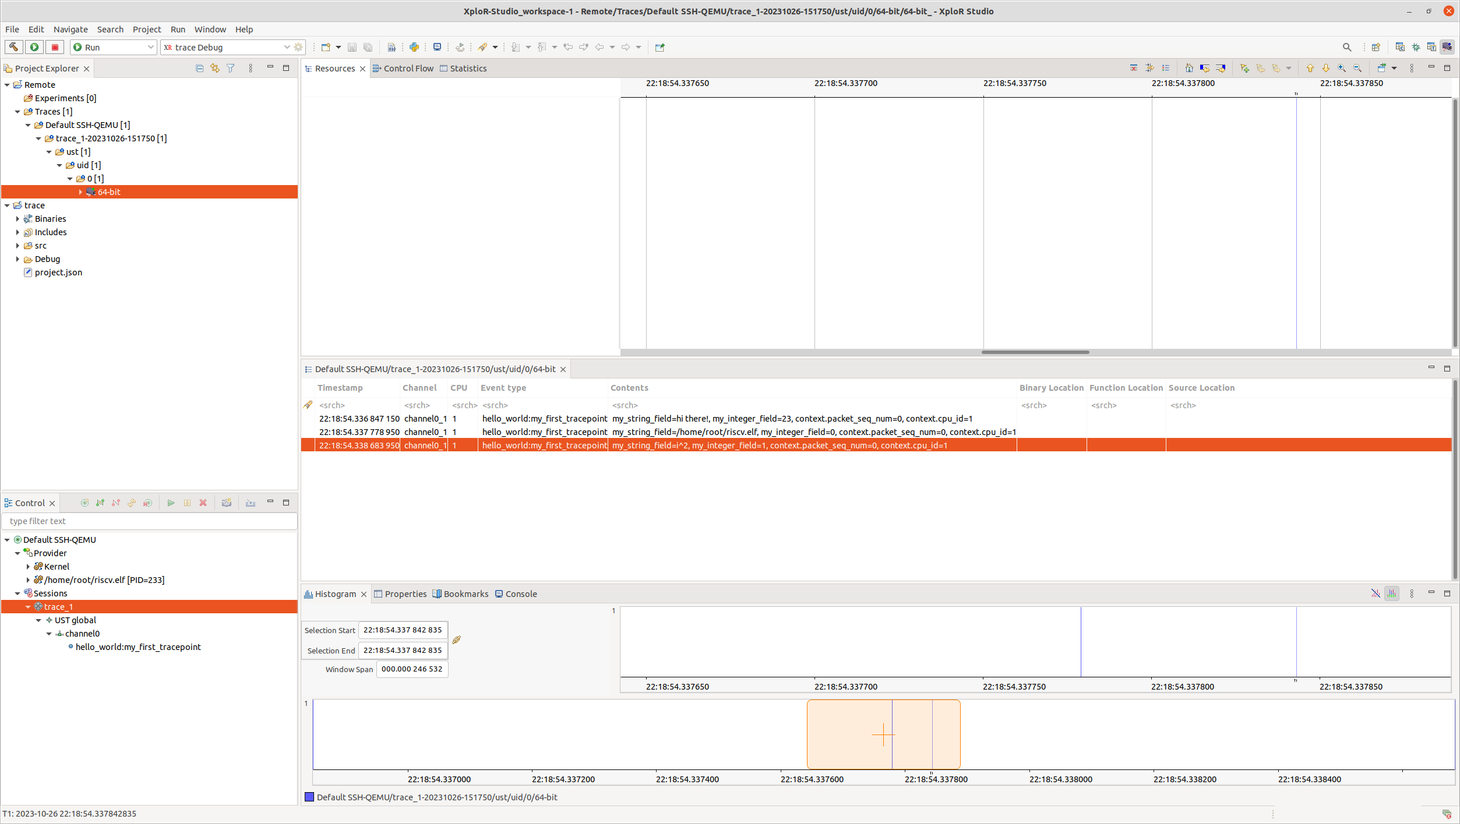
In Project Explorer, double-click on 64-bit:
Kernel Trace
Perform data import similar to the UST section. In case you have already imported data, skip this step.
You can also import both Kernel and UST data if you have created both events. For example:
In Project Explorer, double-click on kernel:
Feedback
Was this page helpful?
Glad to hear it! Please tell us how we can improve.
Sorry to hear that. Please tell us how we can improve.